Cisco Spaces Solution Overview
Available Languages
Bias-Free Language
The documentation set for this product strives to use bias-free language. For the purposes of this documentation set, bias-free is defined as language that does not imply discrimination based on age, disability, gender, racial identity, ethnic identity, sexual orientation, socioeconomic status, and intersectionality. Exceptions may be present in the documentation due to language that is hardcoded in the user interfaces of the product software, language used based on RFP documentation, or language that is used by a referenced third-party product. Learn more about how Cisco is using Inclusive Language.
Whatever your industry, Cisco Spaces can deliver significant outcomes through existing wireless investments.
Cisco Spaces helps to resolve physical-space blind spots so you can better understand the behavior and location of people (visitors, employees) and things (assets, sensors). This cloud-based platform, which is compatible across Cisco® Aironet®, Cisco Catalyst®, and Meraki® wireless access points, lets your enterprise see what's happening at its properties, act on these insights, and extend platform capabilities via integrations and partner applications.
With Cisco Spaces, you can now extract even more value from your Cisco wireless technology investments. Equally important, this value extraction is tied directly to your organization's critical operations and business outcomes. Cisco Spaces enables you to understand how people and things are behaving in your spaces.
● Simplification: A single, unified platform for accessing location products and apps and for normalizing data to create meaningful insights
● Cloud first, scalable: A cloud-first Software-as-a-Service (SaaS) approach that enables rapid and scalable deployment via the connector
● Open and unified ecosystem at a lower Total Cost of Ownership (TCO): Cisco Spaces Indoor IoT Services helps customers deliver multiple applications and use cases at scale, with a lower TCO
● Standardization: Compatibility and interoperability across all Cisco wireless—Aironet, Catalyst, and Meraki
● Robust privacy and security: Enables control over your data privacy with a General Data Protection Regulation (GDPR) shared privacy model
● Support: 24x7 monitoring and Service-Level Agreements (SLAs) for end-to-end reliability
● Low touch: No need to upgrade your underlying network infrastructure to activate service
Rich Maps for Better Employee Experiences
Cisco Smart Workspaces transforms flat floor plans into dynamic, interactive, and highly intuitive, 3D maps. Our rich maps can be used in WebEx boards and a variety of other digital signages, to provide contextual awareness, easily locate empty meeting rooms, desks, and find important points of interest.
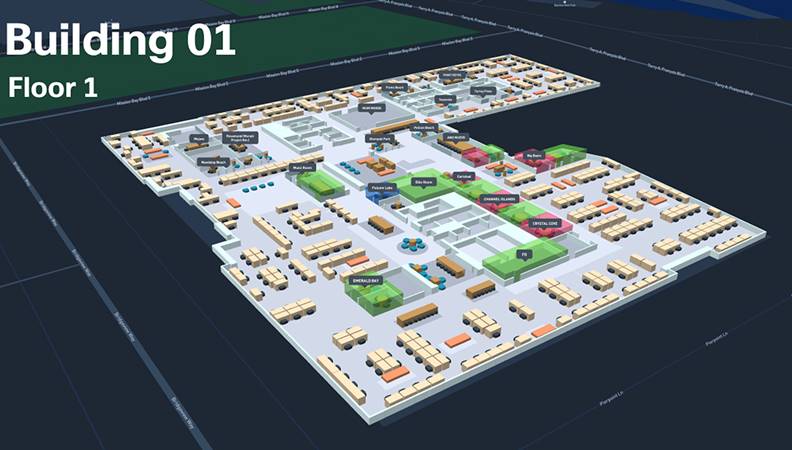
Interactive, dynamic 3D maps for contextual experiences
Safety and Well-being:
Employees can now put their safety and well-being first, with access to real-time occupancy and environment updates (indoor air quality, volatile organic compounds, temperature, humidity, noise levels, etc.) across a specific building, floor, or meeting room.
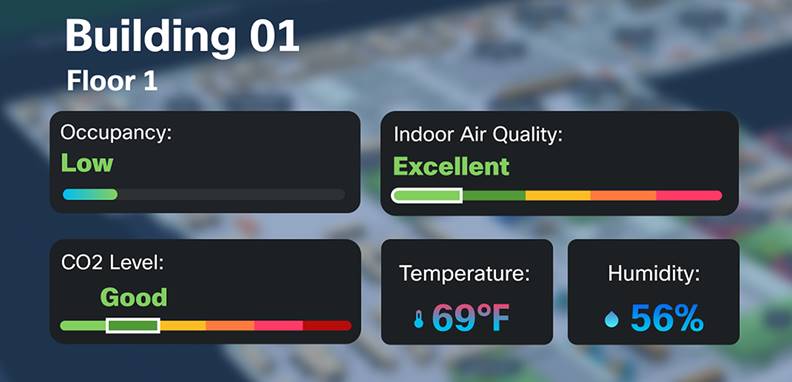
Real-time occupancy and air quality alerts to support safety and wellbeing
Now with Cisco Smart Workspaces, visualize live meeting room and desk availability along with key environmental parameters such as temperature, humidity, and noise. Temporarily hold meeting rooms until you get there, with the touch of a button on the digital signage.
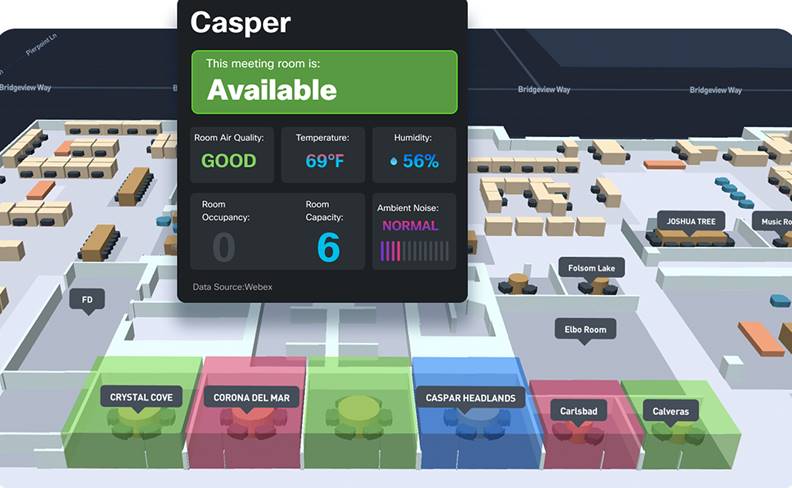
Live meeting room and desk availability for a better employee experience
Real-time Occupancy and Space Utilization
Right Now
View real-time metrics on the active visitors currently at your location. Using these metrics, you can set density threshold rules to specify the maximum number of people that can occupy your location. Density rules can be set either as density per area or as a device count. You can also specify which building, floor, or zone you would like the rules to apply to. When the density rule is exceeded, a safety notification can be triggered to Cisco Webex Teams™, SMS, email, or API trigger.
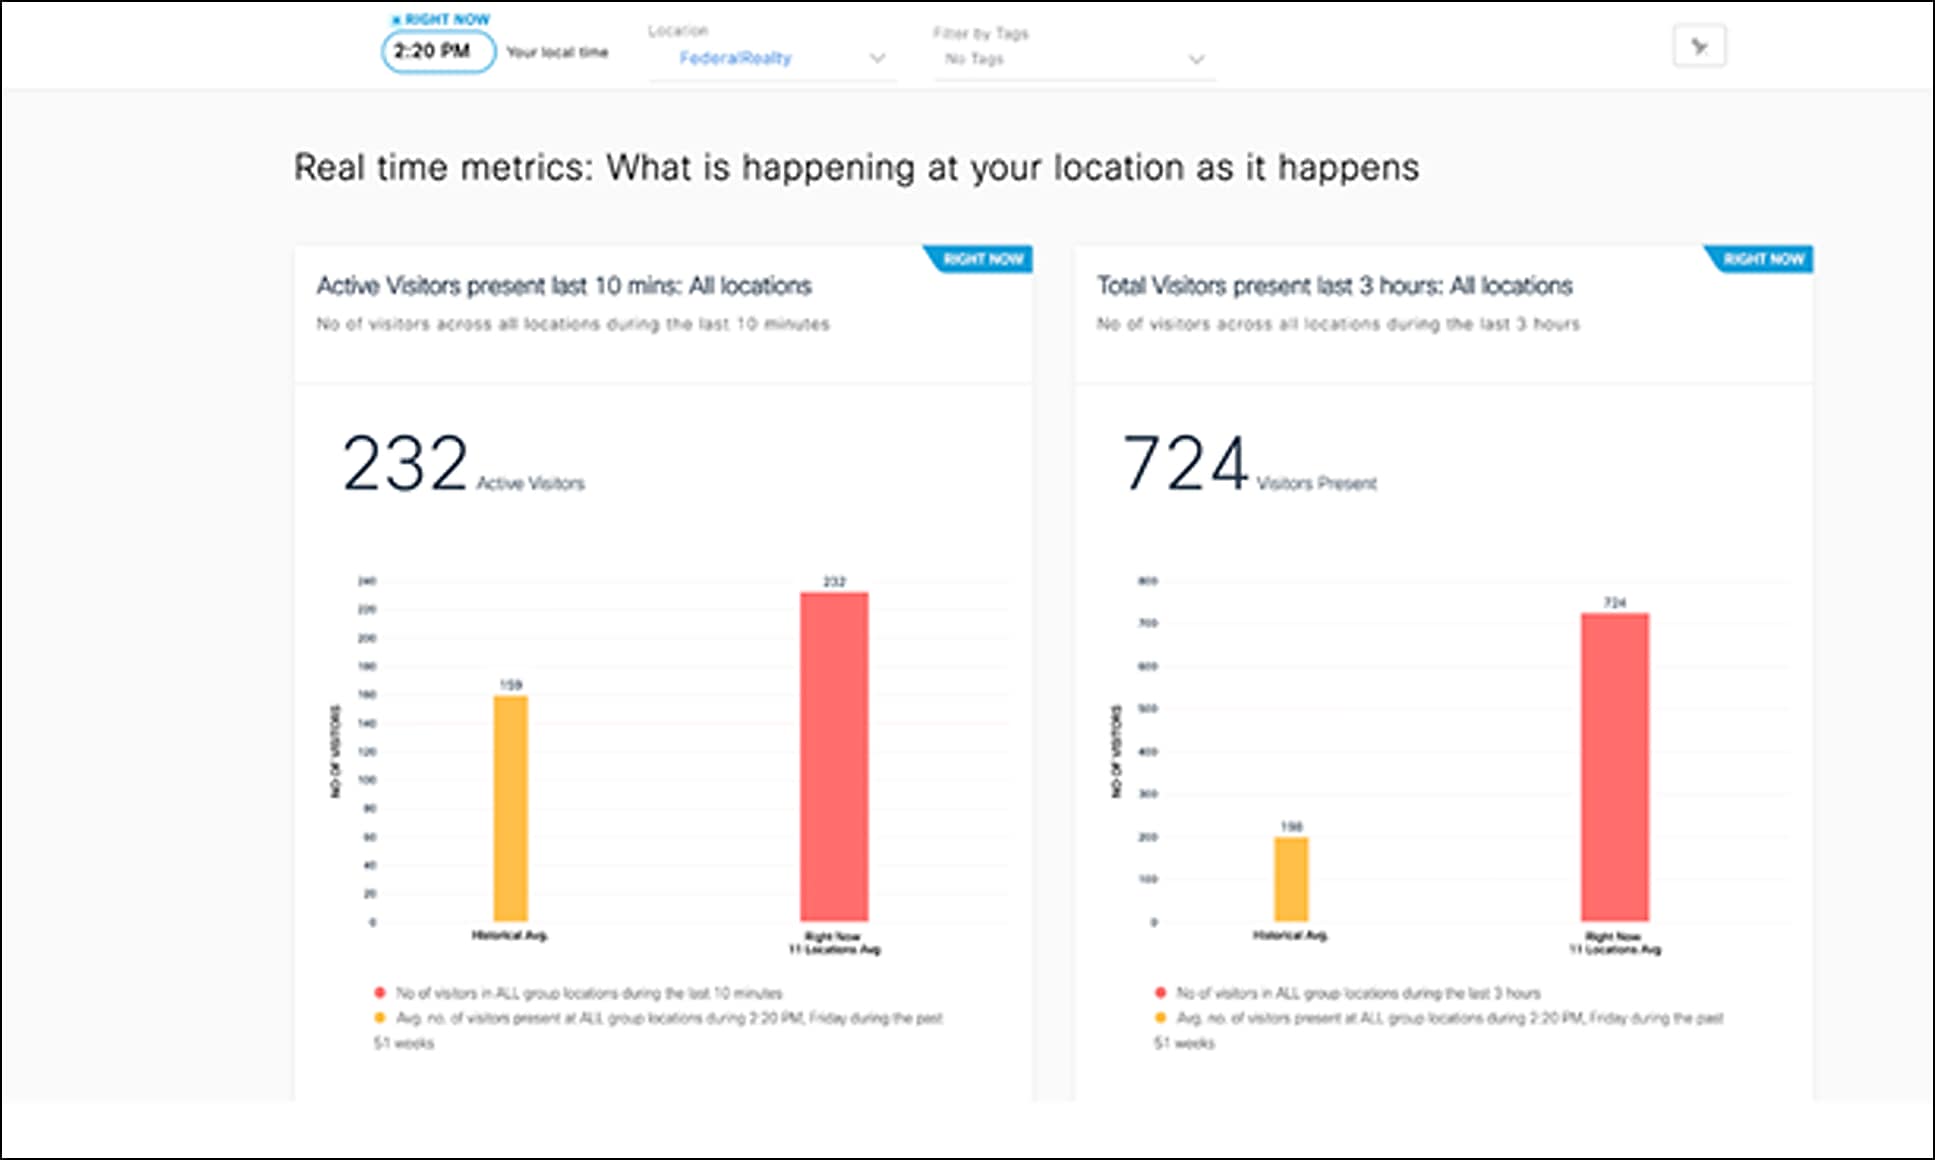
Right Now app displaying number of active visitors by location

Configure density rules for specific locations, buildings, floors, and zones
Space Manager
• Real-time occupancy: See where people are located in your space and how they use your workspaces, on a 3D map of your floor
• Heat maps: Watch the floor occupancy heat maps change in real-time or play them back over the past 24 hours to discover spaces with the most and least foot traffic
• Real-time insight into the ambient conditions in the workplace. monitoring the indoor air quality in individual rooms and spaces, displayed on digital floor plans
• Meeting room occupancy: Visualize live meeting room occupancy at any point in time
• Sensor architecture overview: Get an overview of the sensor architecture at your workspaces and identify coverage gaps. Associate and manage sensors in your workspaces at scale
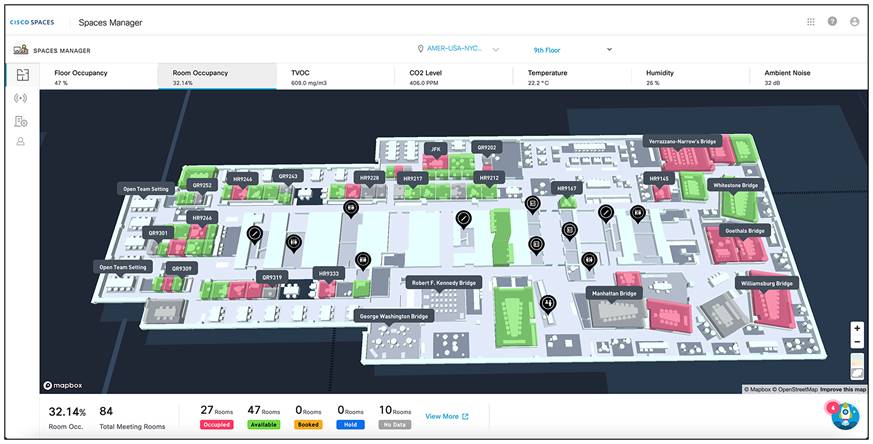
Real-time actionable insights with heatmaps for air quality and space occupancy
Environmental Analytics:
● Get a combined view of all Cisco environmental sensors
● View and analyze detailed environmental trends at your workplace - air quality, temperature, humidity, CO2, noise, etc.
● Get updates on deviations and anomalies and employees are working in a safe environment
● Understand historic trends to inform building schedules
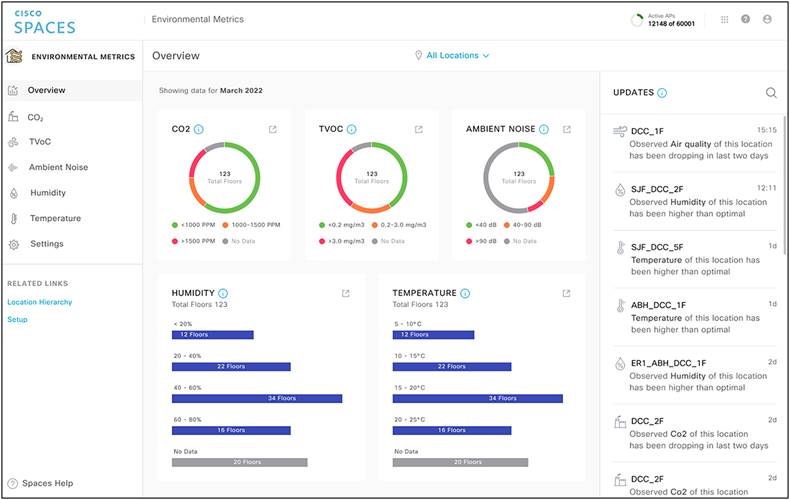
Environmental Metrics provide detailed metrics into the health of your spaces
Energy Utilization:
● See how your network consumes power across PoE devices
● Understand network energy utilization to help achieve NetZero goals for a more sustainable footprint
● Integrate select Smart PDU's to understand more about your energy utilization
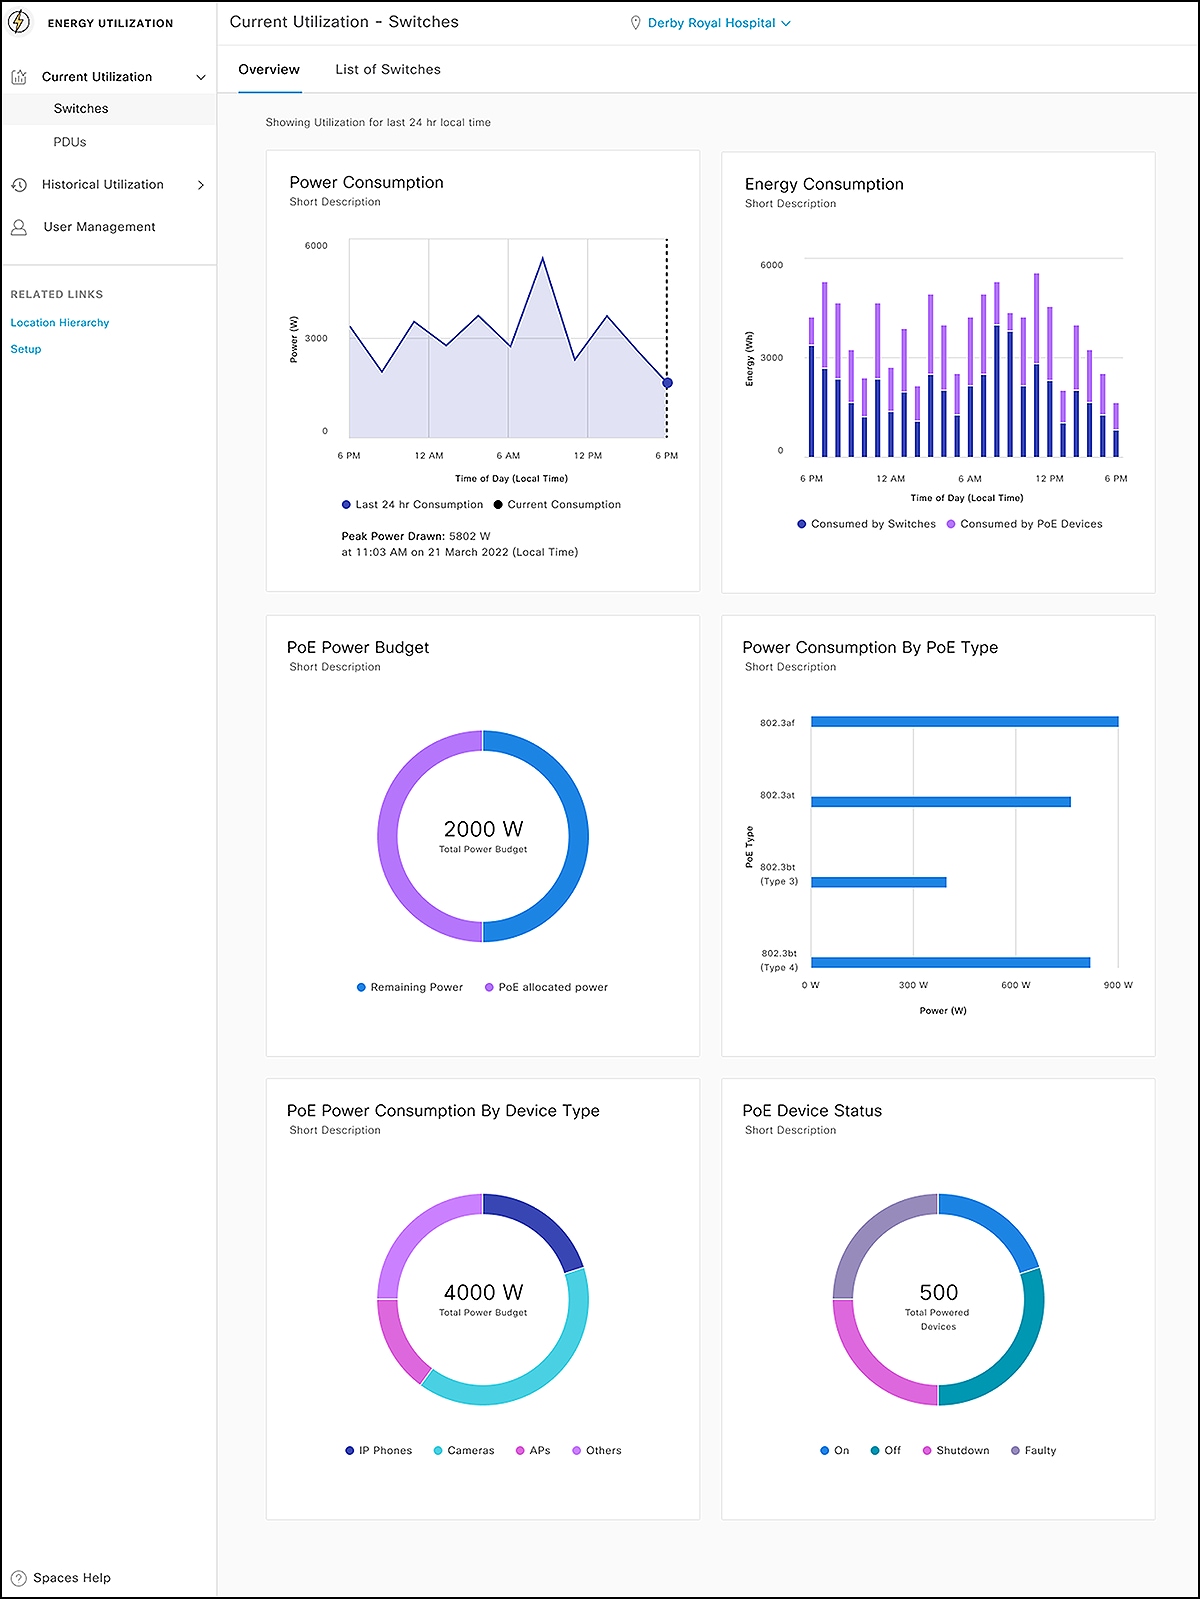
Energy Utilization provides visibility and actionable insights into the consumption of power from PoE devices
Meraki video camera metrics
Get insights into the behavior of people within physical spaces using data derived from Meraki video cameras. With the Camera Metrics app, you can analyze the number of entries into a space and the number of people in a space over a certain period of time. The app allows you to slice behavior by location and time. Activation of the Camera Metrics app will also enable real-time reporting of current density from cameras via the Right Now app.
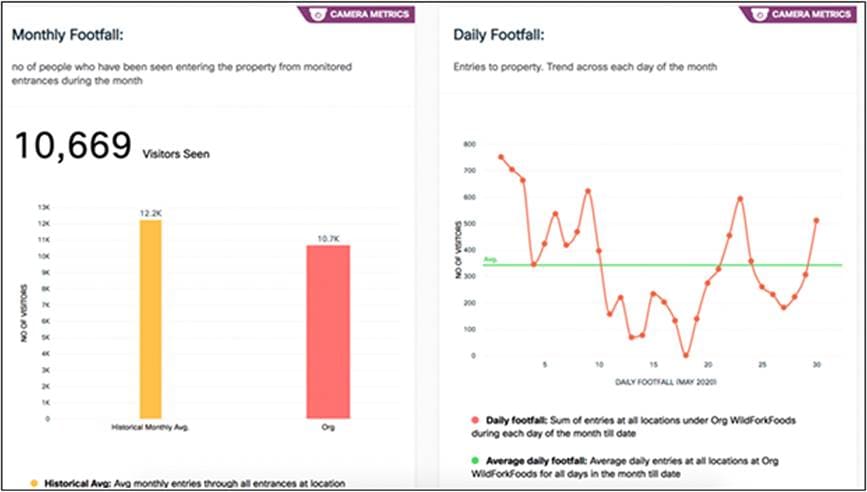
Get a footfall count of the number of people seen entering your location from monitored entrances
Proximity Reporting - BI
Understand where an individual has been if they reported exposure to or infection by the virus. You can trace where that person has gone, be it a floor, zone, or building. You can also see what users were in the same space at the same time. The report will show a summary of the impacted spaces, users, and dwell time. You can categorize risk levels in the report based on proximity and dwell time. A useful outcome of this report is the ability to focus cleaning efforts on the impacted buildings or floors, which can help save time, resources, and costs. Proximity Reporting can be leveraged through your existing network and does not require additional installation of a mobile app or hardware.
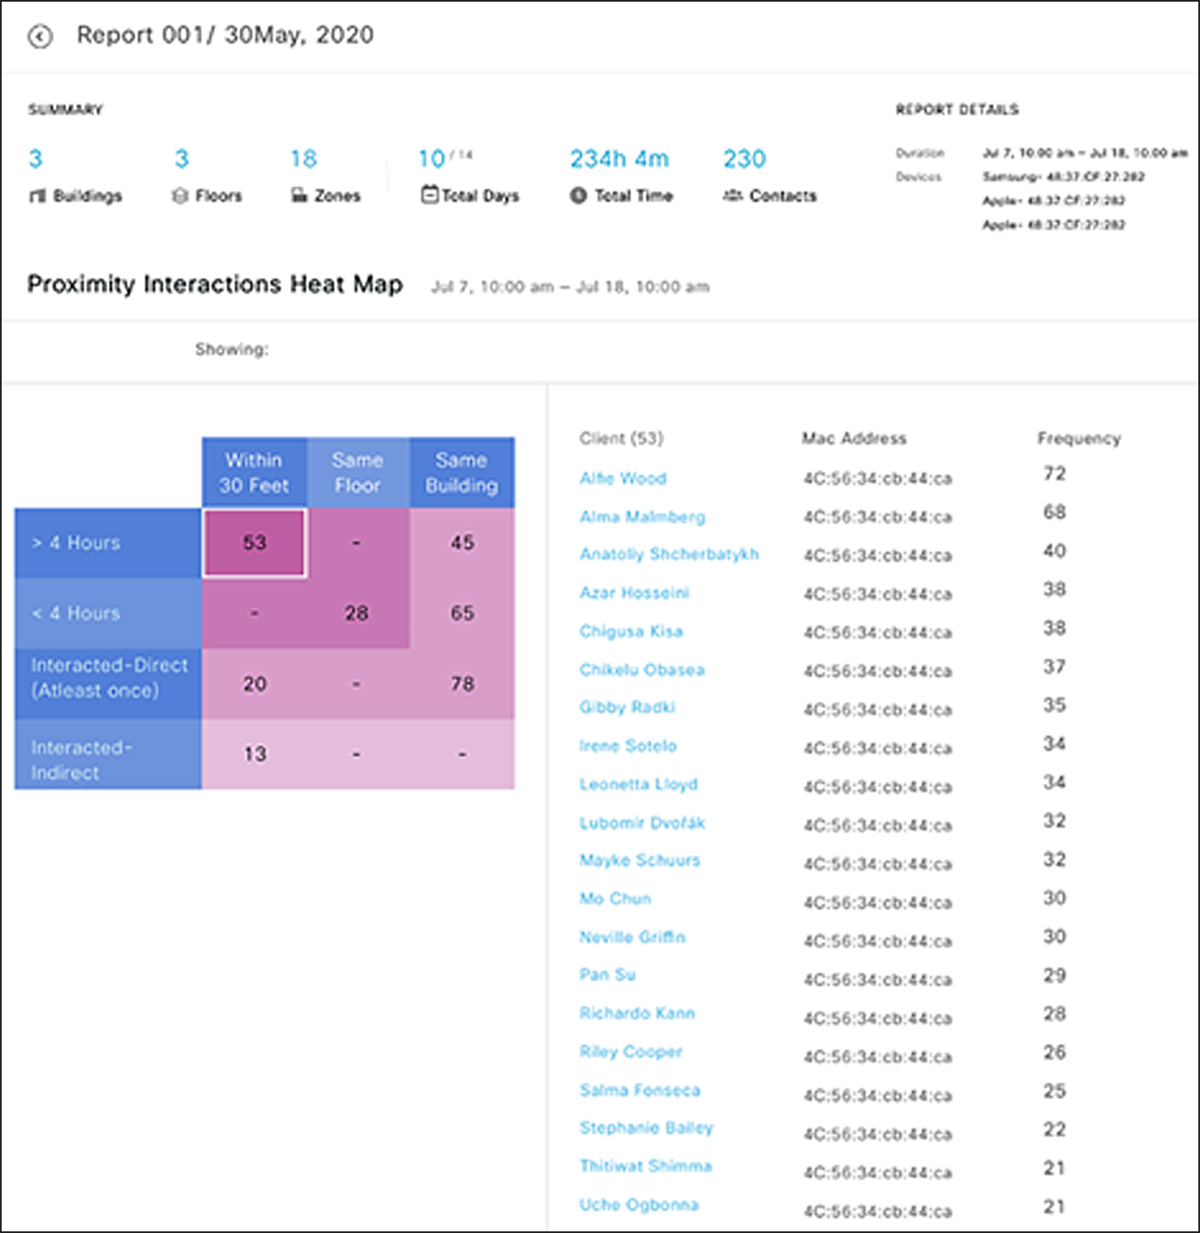
If a person self-reports exposure, a proximity report can be generated that includes information on recently visited buildings and floors, and the amount of time spent there
Use analytics and insights to drive key business decisions.
Location Hierarchy
The Location Hierarchy capability enables you to manage and group locations based on business taxonomy. What we're doing is translating the IT backbone you already have (your wireless access points) into business context and nomenclature to create a centralized management view across all locations. You can group locations by geography, state, brand, type of store, zone, and more.
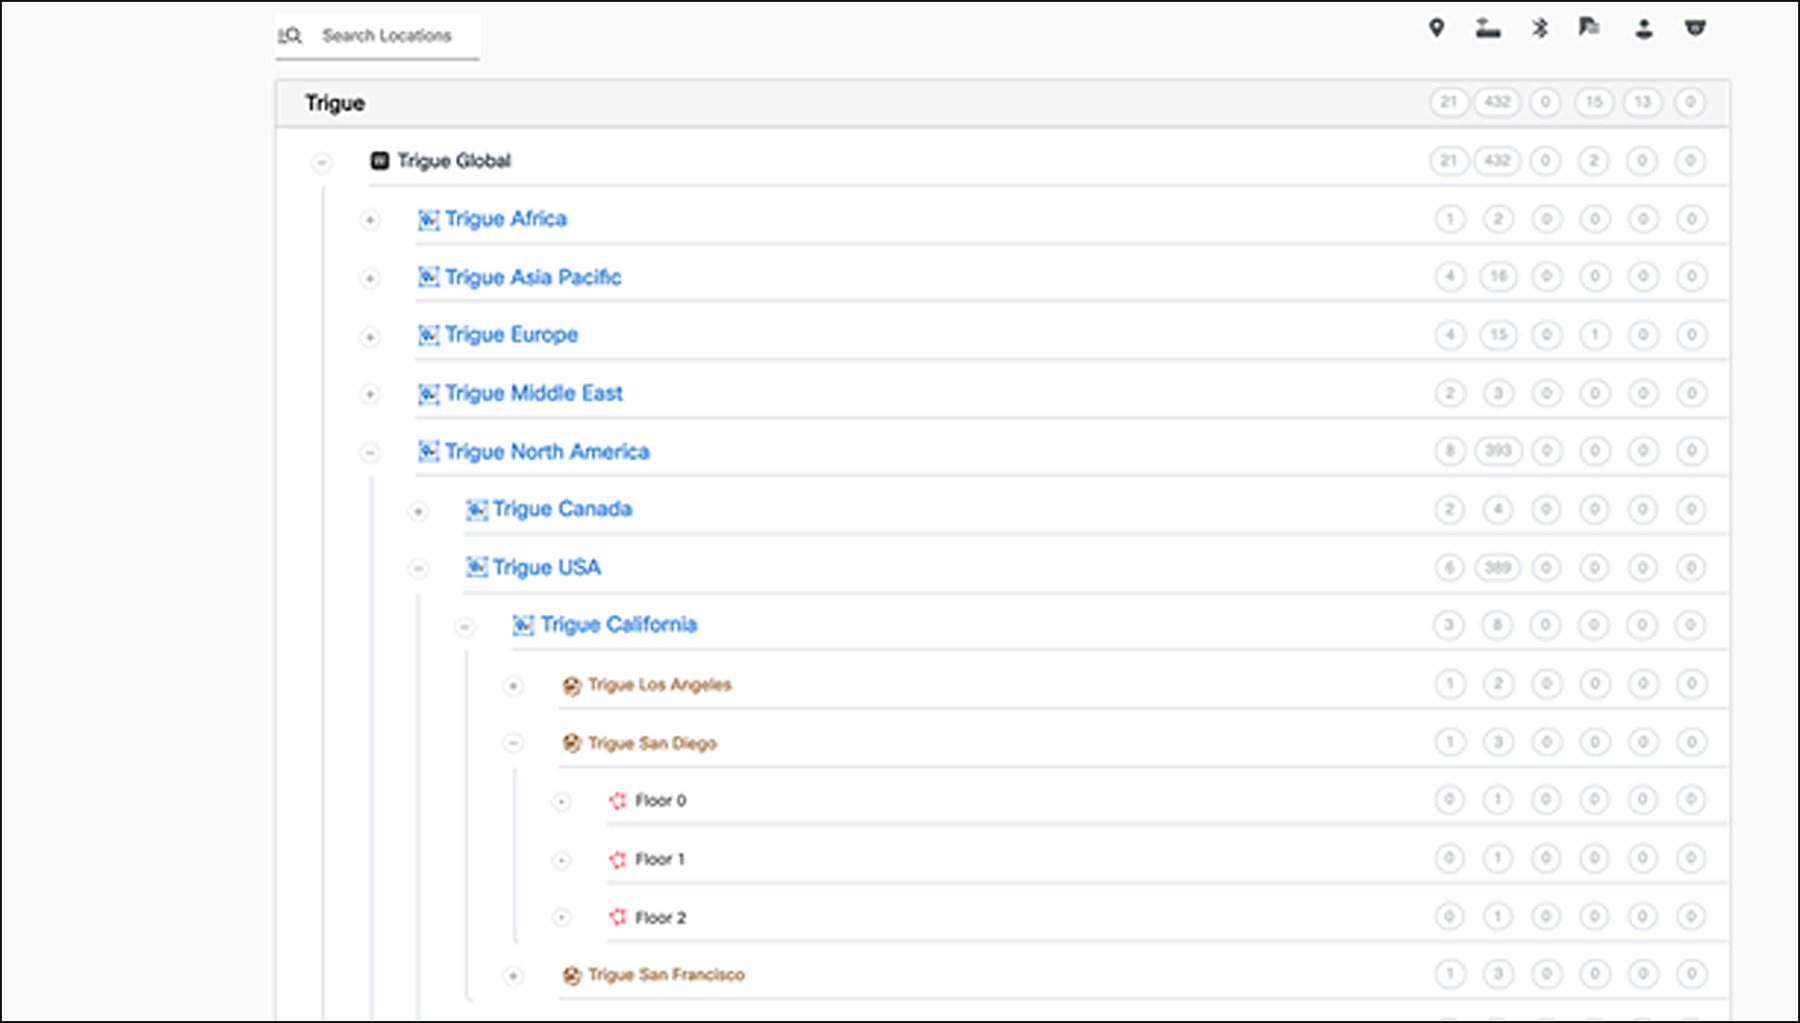
Search locations through Location Hierarchy
Behavior metrics
Measure visitor behavior throughout one or more properties. With this set of metrics, you can gain an understanding, for example, of how behavior trends change from month to month, how subsequent visits affect dwell times, and how visits are affected by external events. Example metrics include visit duration, visit frequency, visit distribution, and impact analysis.
Benchmark and compare your property's performance to gain valuable context.
Impact Analysis
Measure the impact of events, campaigns, and layout changes on location behavior.
These metrics help you infer whether events such as the pandemic, campaigns, promotions, or return-to-office routines have led to a desirable increase or decrease in visitor activities at your location. For example, a workplace resources manager will want to assess whether employees are spending an appropriate amount of time on their campuses. With Impact Analysis, you can filter to a specific location and look at its visit counts and visit durations.
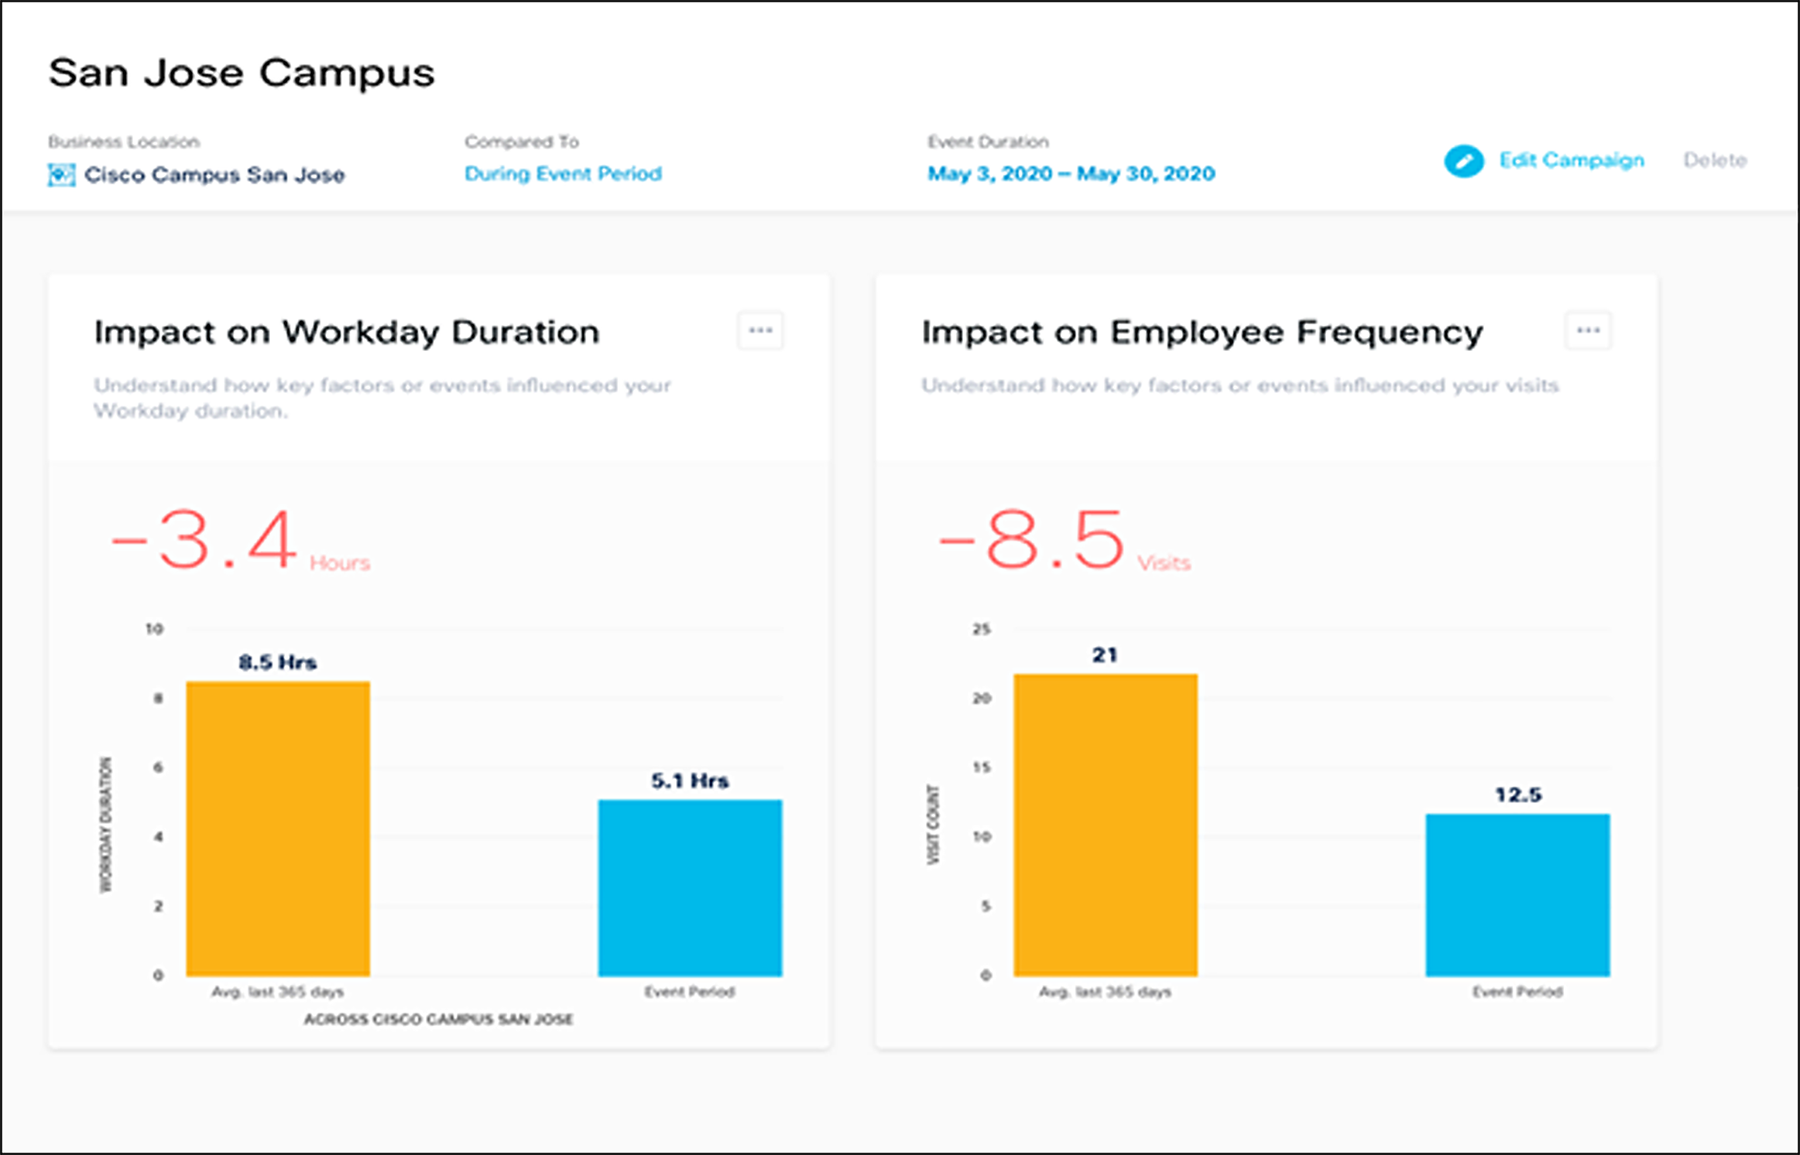
Impact Analysis for the San Jose campus, displaying how the visit duration and visit count during the return-to-office period compare to visit activities in the previous period
Location Analytics
Gain visibility into customer behavior patterns such as visitors, visits, and dwell times. You can filter by various business criteria such as location and time period. You can also view industry and organizational benchmarks for the visit duration and visit frequency metrics.
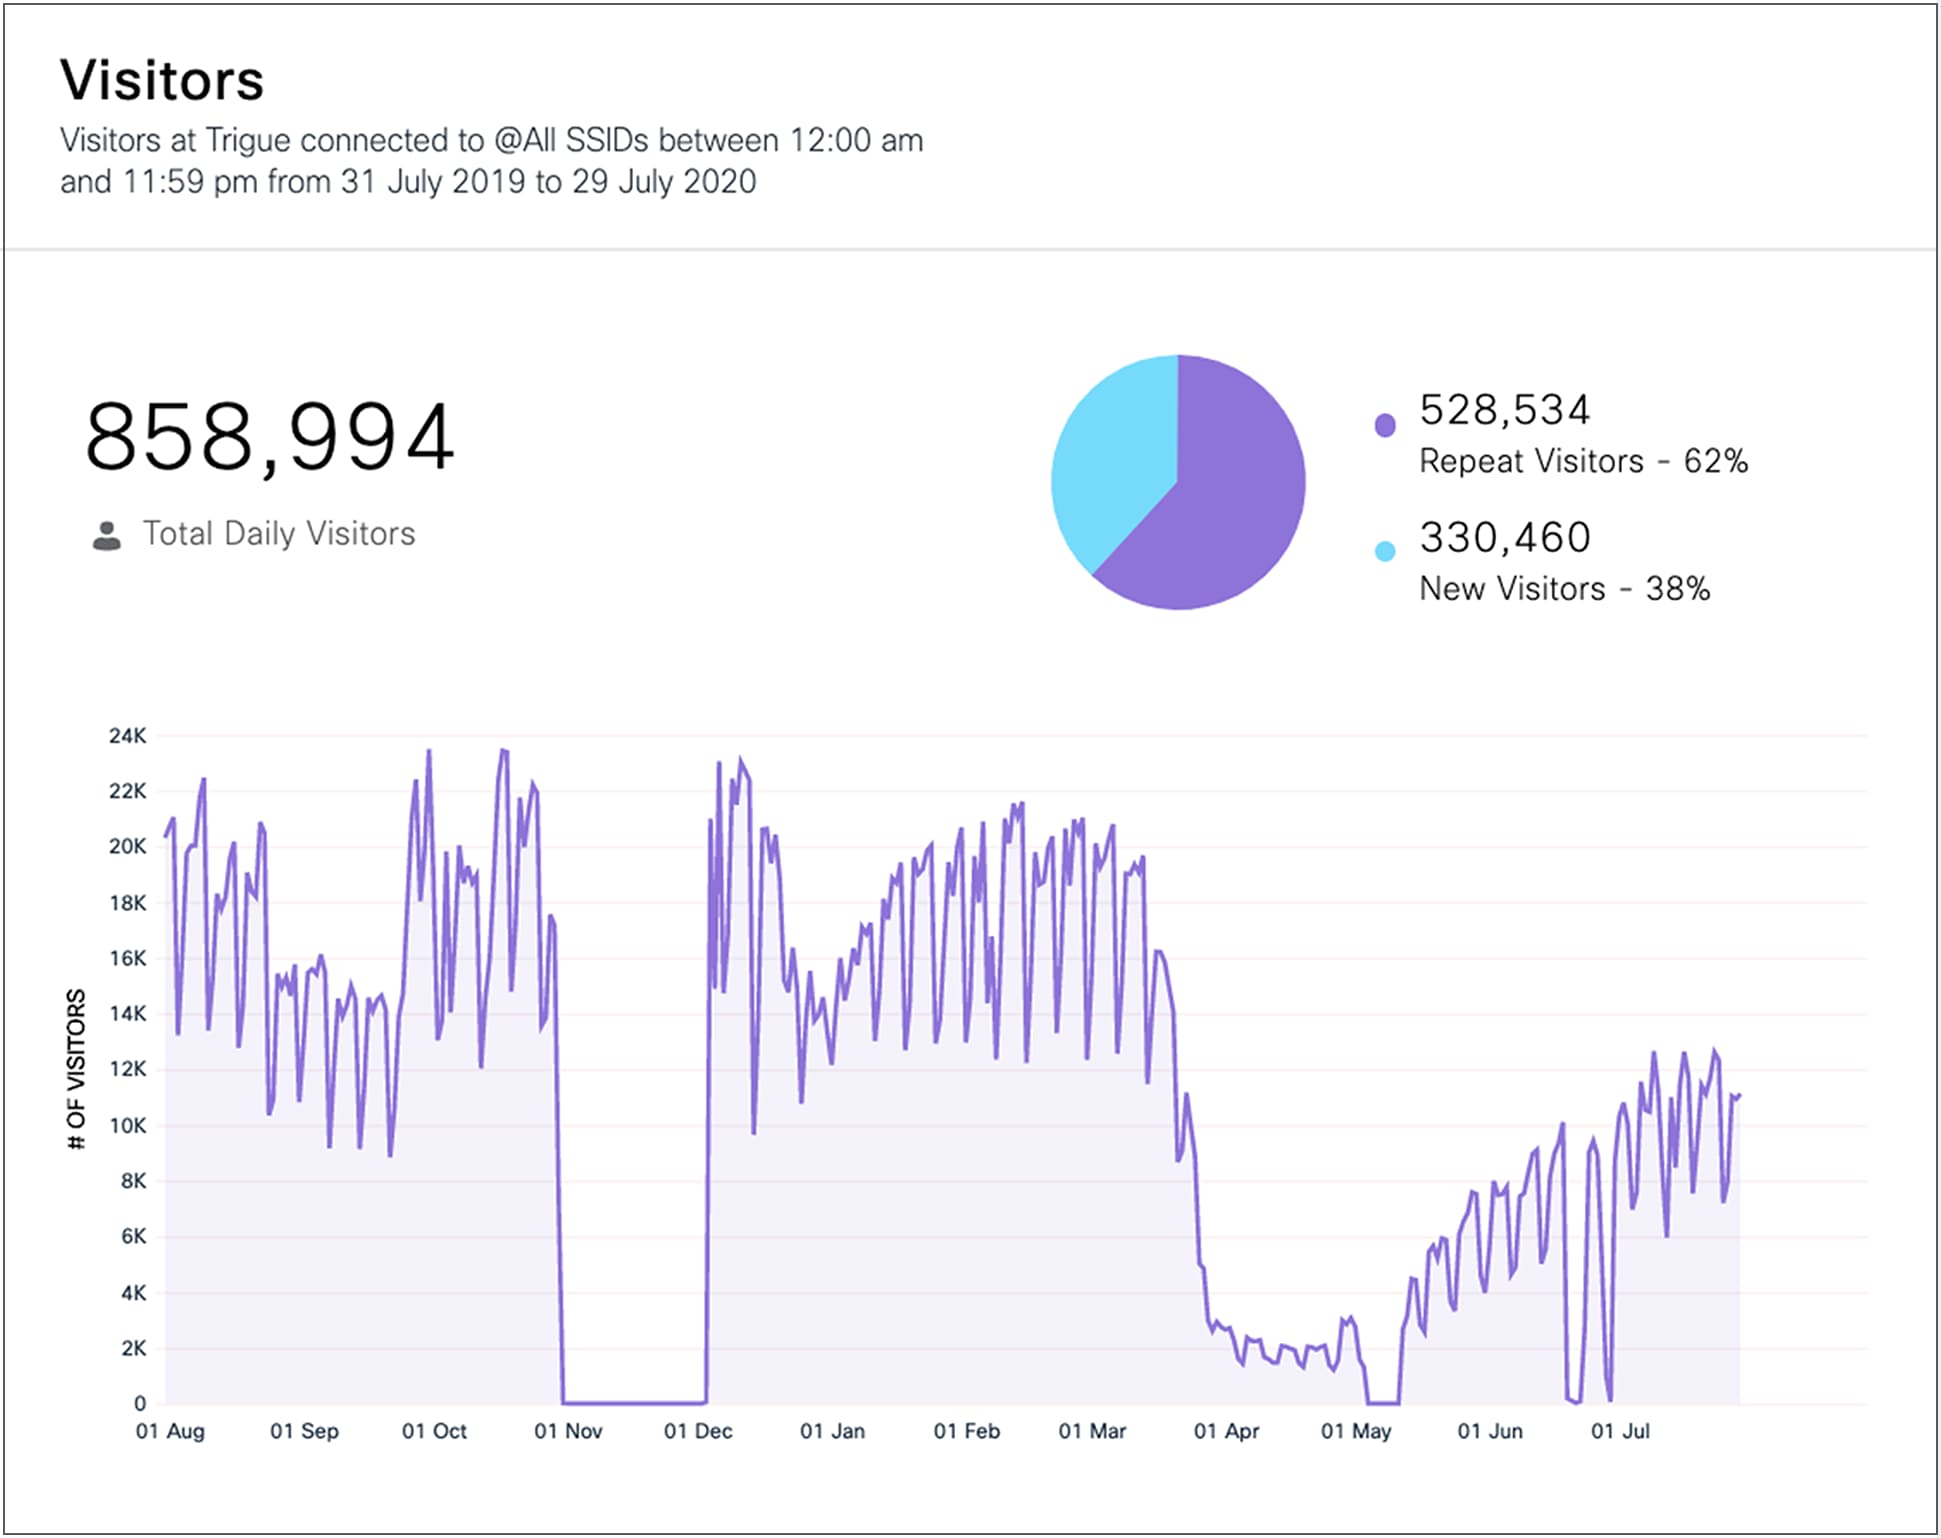
Location Analytics displays the number of daily visitors, as well as a breakdown of repeat vs. new visitors, over a 1-year timeframe
Detect and Locate (advanced)
This feature enables you to view and locate devices onsite. Cisco Spaces provides access to device location history and APIs to access both real-time and historical data.
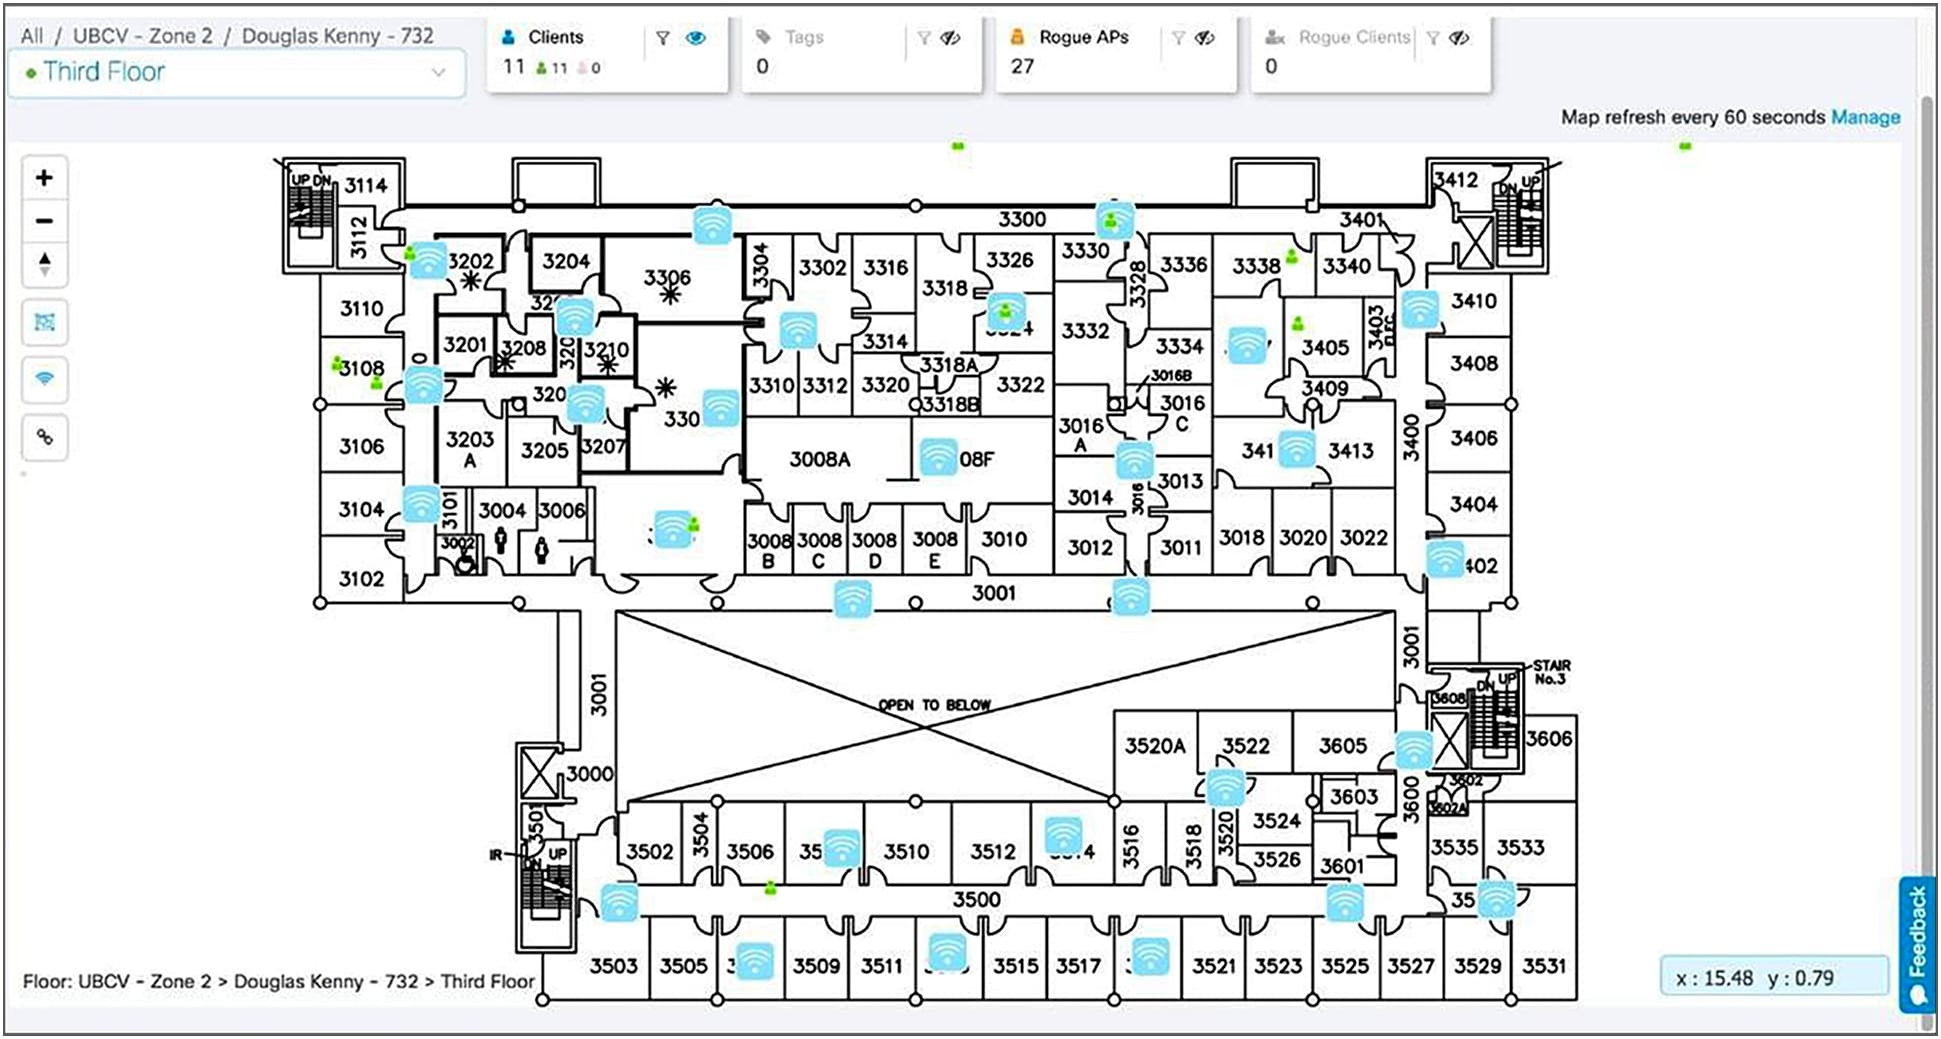
Example of Detect and Locate on the dashboard
Meraki video camera metrics - BI
Get insights into the behavior of people within physical spaces using data derived from Meraki video cameras. With the Camera Metrics app, you can analyze the number of entries into a space and the number of people in a space over a certain period of time. The app allows you to slice behavior by location and time. Activation of the Camera Metrics app will also enable real-time reporting of current density from cameras via the Right Now app.
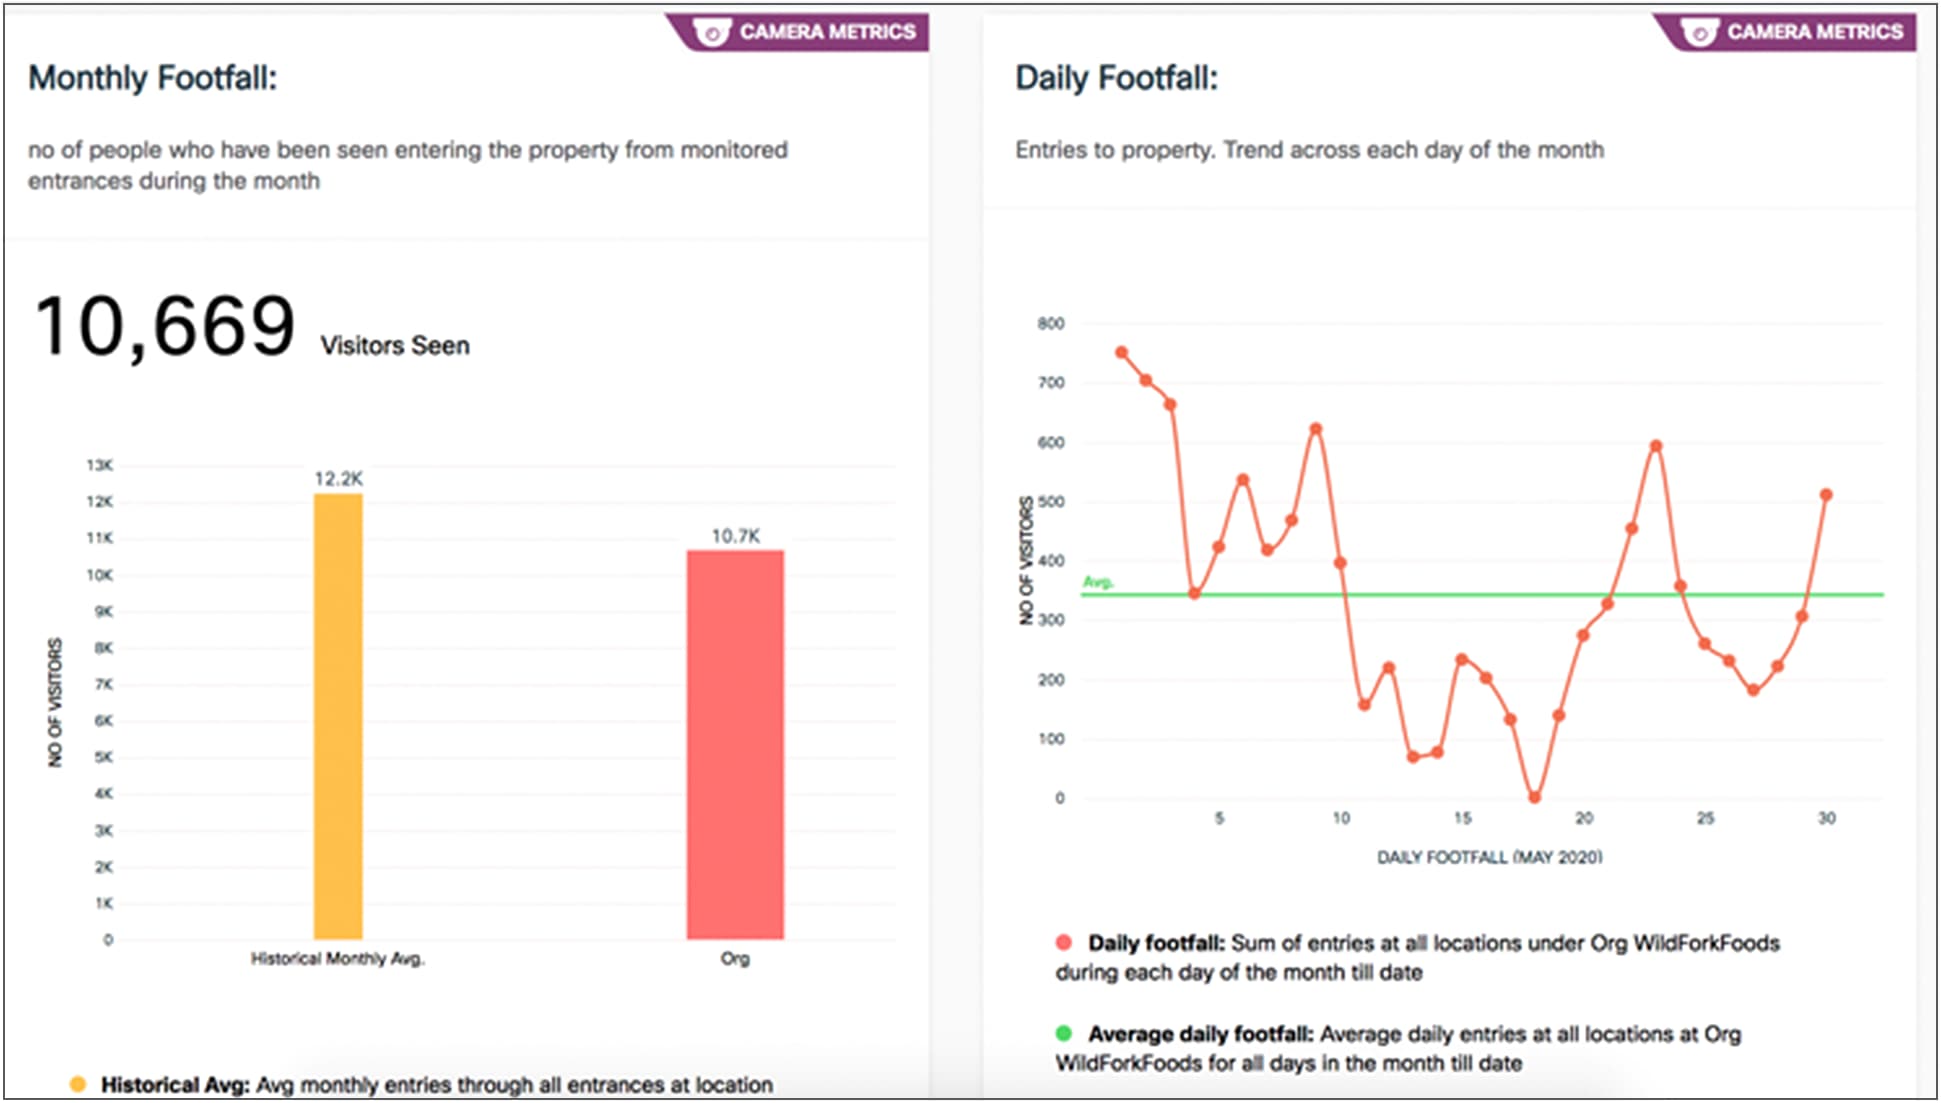
Get a footfall count of the number of people seen entering your location from monitored entrances
Proximity Reporting
Understand where an individual has been if they reported exposure to or infection by the virus. You can trace where that person has gone, be it a floor, zone, or building. You can also see what users were in the same space at the same time. The report will show a summary of the impacted spaces, users, and dwell time. You can categorize risk levels in the report based on proximity and dwell time. A useful outcome of this report is the ability to focus cleaning efforts on the impacted buildings or floors, which can help save time, resources, and costs. Proximity Reporting can be leveraged through your existing network and does not require additional installation of a mobile app or hardware.
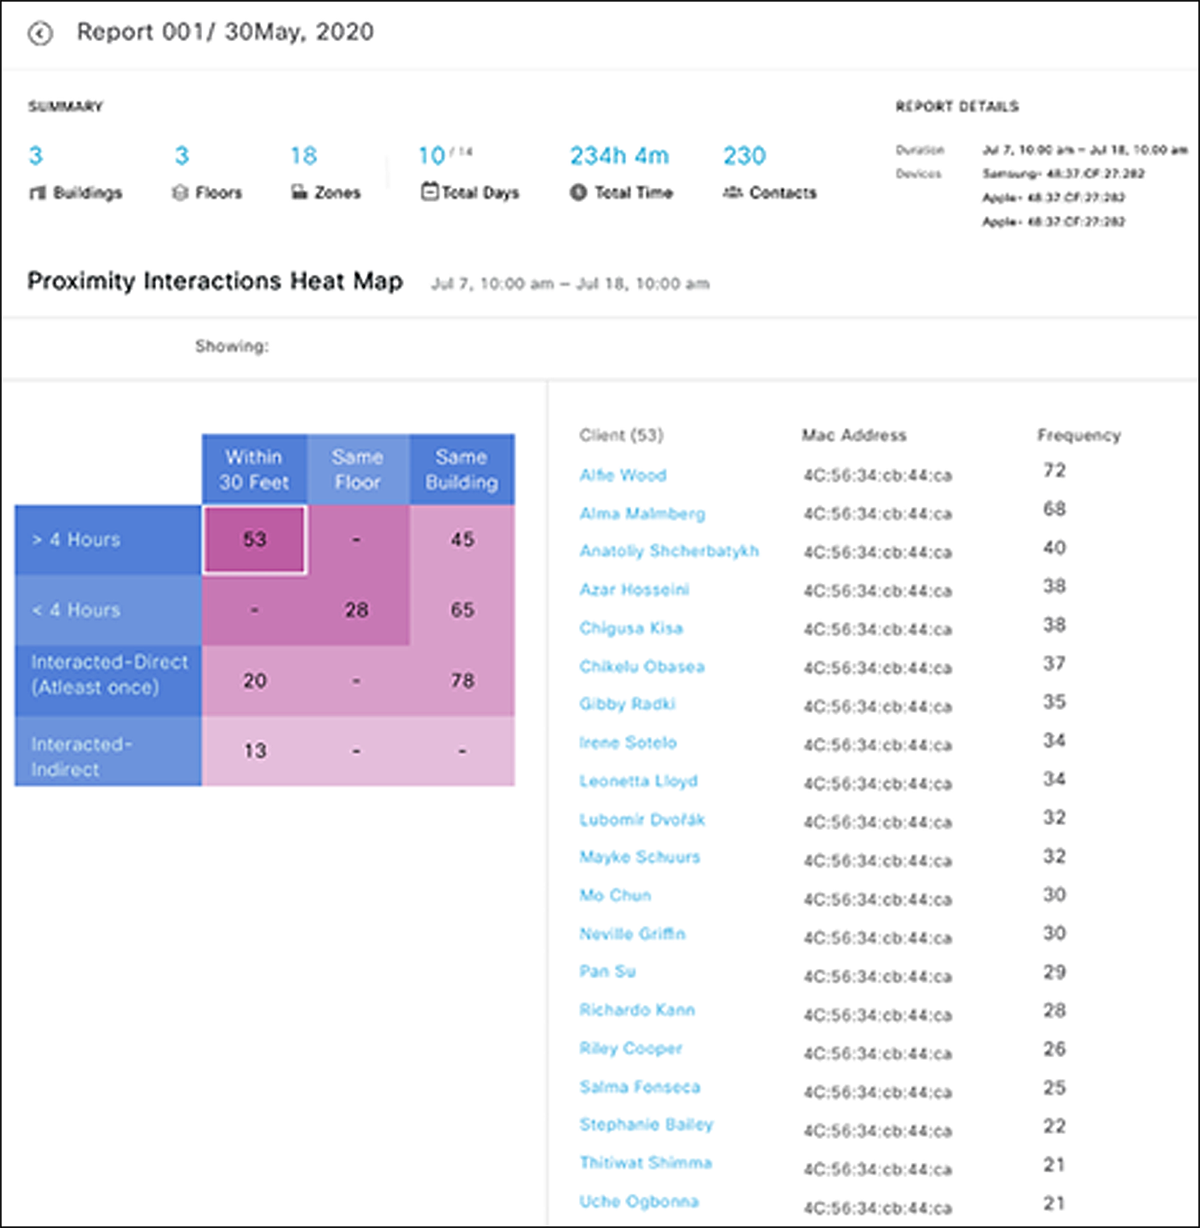
If a person self-reports exposure, a proximity report can be generated that includes information on recently visited buildings and floors, and the amount of time spent there
Provide safe, contextual experiences to customers without compromising quality.
Captive portals
The captive portal is the first touchpoint with your business for customers on Wi-Fi. It is an opportunity to engage with customers who connect to Wi-Fi, provide relevant information, drive monetization, and potentially acquire customer information. Captive portals enable businesses to choose from multiple authentication mechanisms (such as phone number, email, social media information, and acceptance of terms and conditions) and to deliver targeted experiences based on business rules (who, what, when, where, and so on). For example, the captive portal can recognize repeat visitors by name and deliver customized offers (such as for exclusive savings or bonus loyalty points on a visitor's fifth visit).
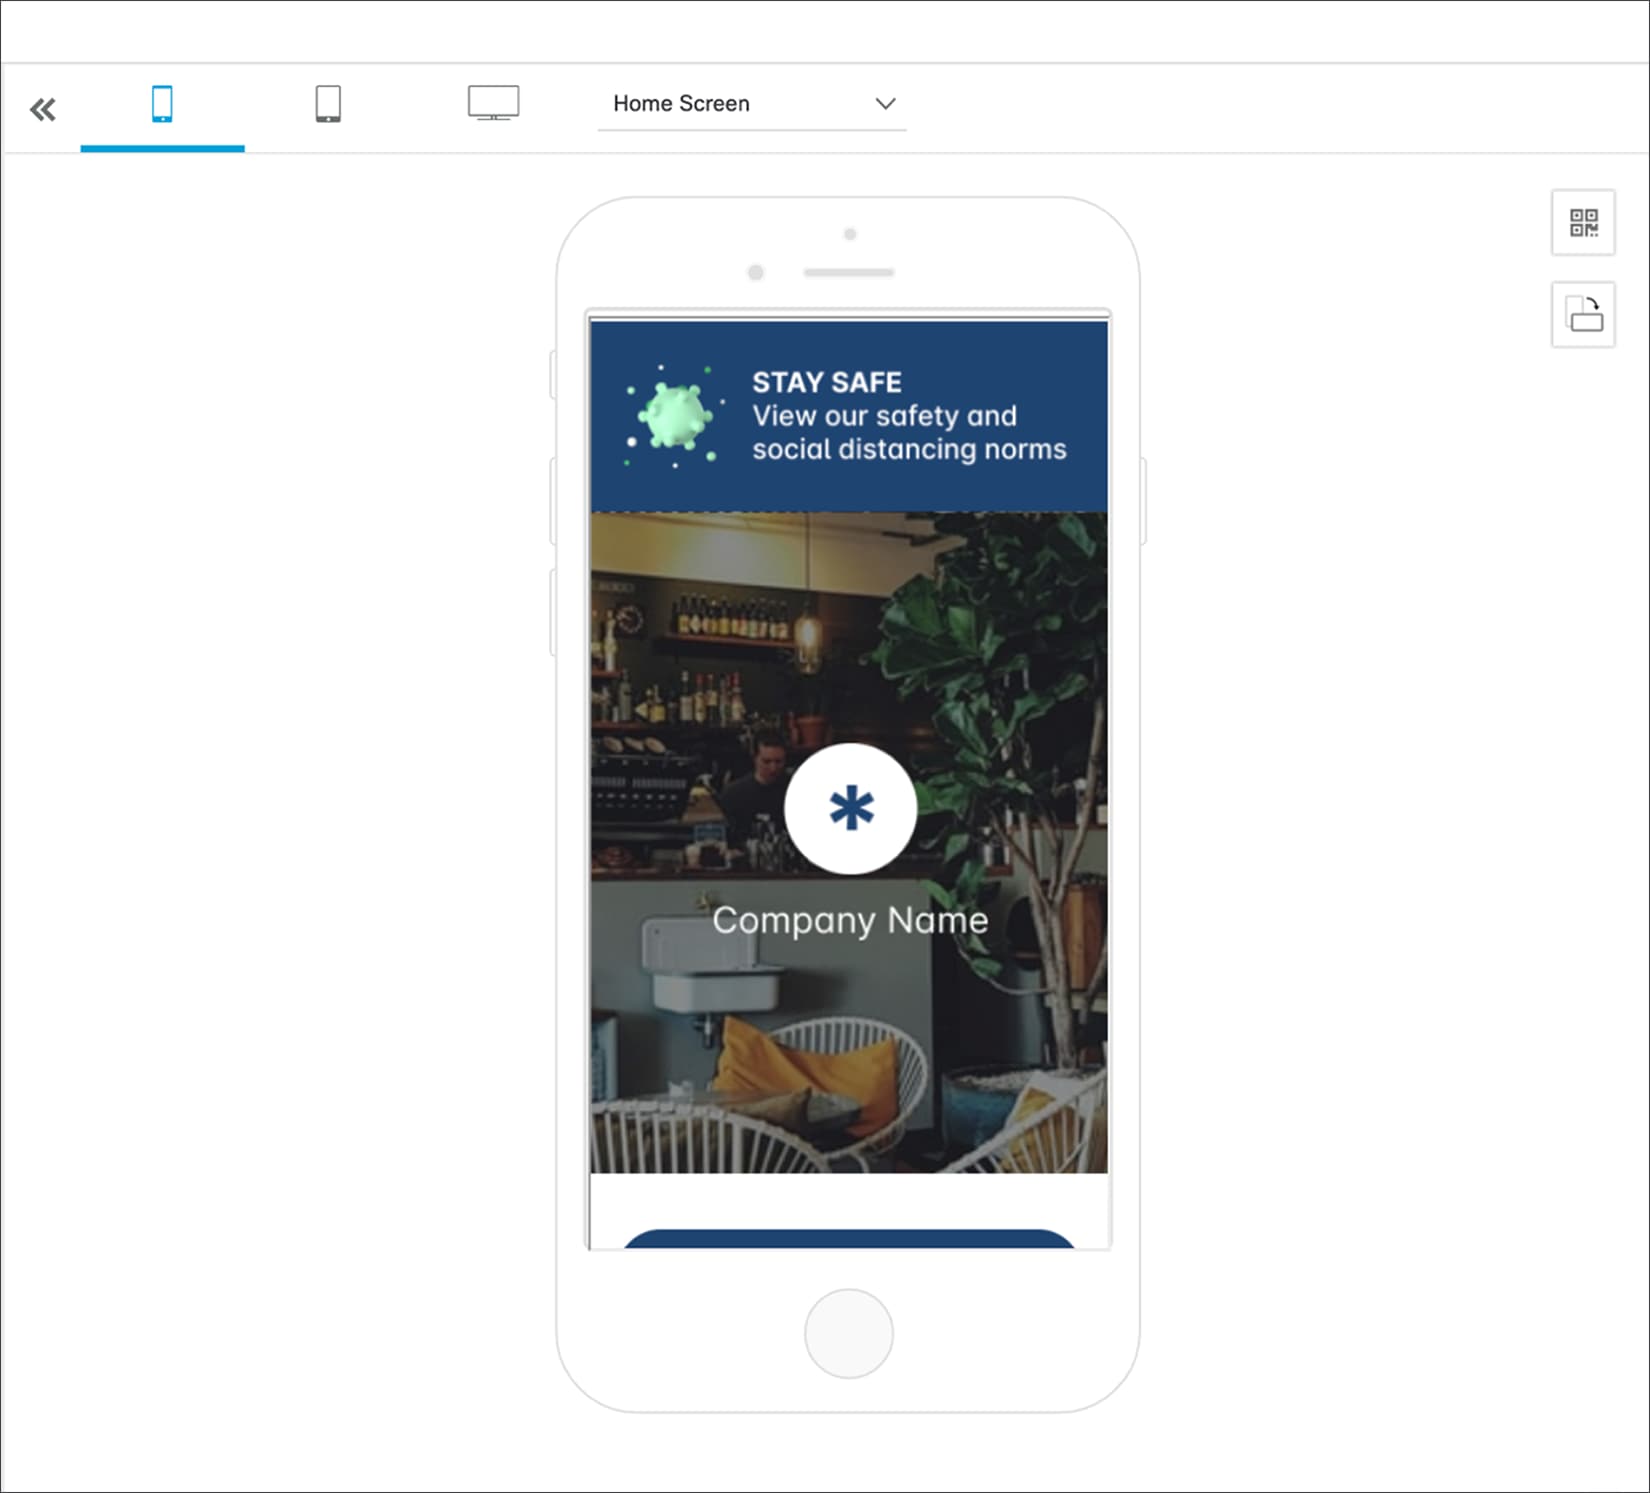
Leverage a COVID-19 captive portal template from a list of sample templates
Location personas
Cisco Spaces enables you to profile and segment users based on at-location behavior. You can identify key segments and personas and get a detailed picture of their behavior at your location. This information enables you to deliver targeted engagements based on personas. The types of location personas will depend on your industry. Location personas we've seen are repeat visitor, cross-property visitor, loyalty member, high dweller, season-ticket holder, and more.
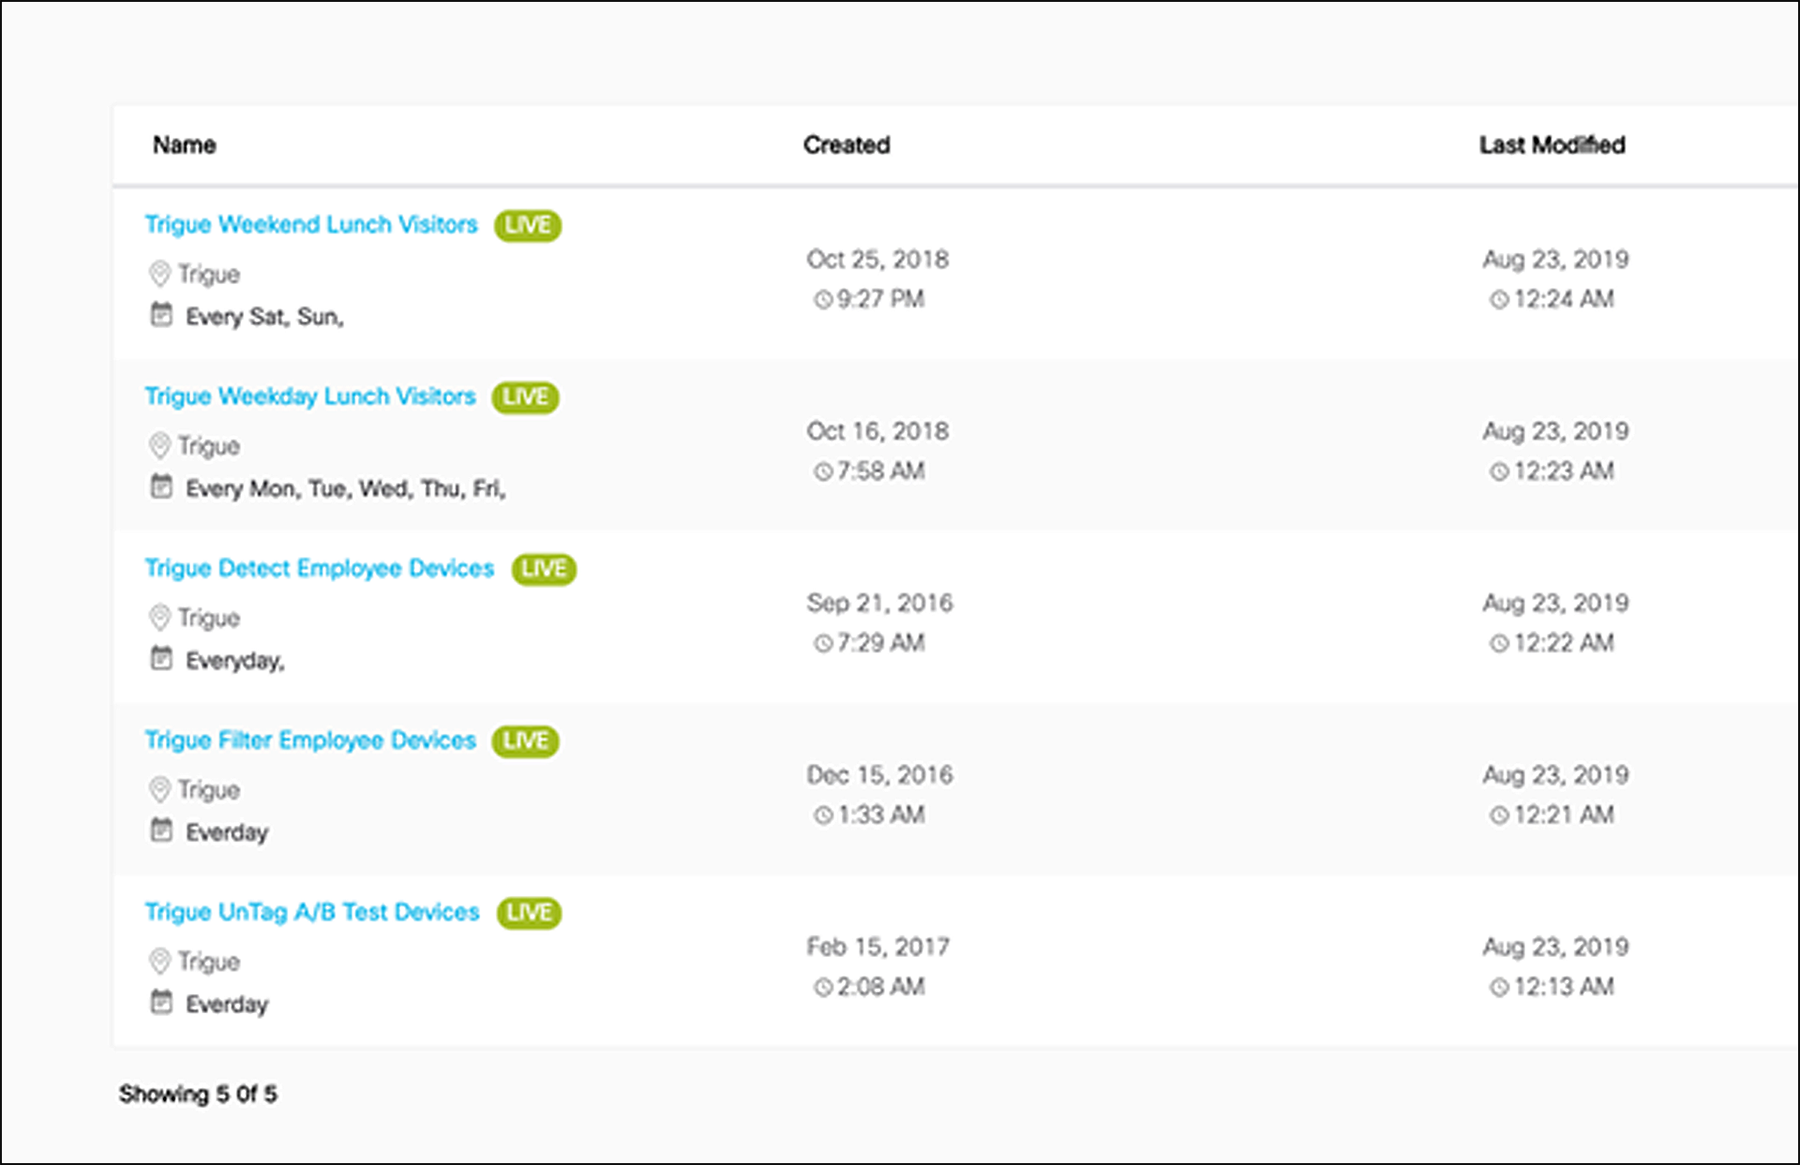
Create personas for weekday and weekend lunch visitors
Engagements
With Cisco Spaces Engagements, you can leverage the right channels at the right time and place. Trigger contextual multichannel engagements based on the behavior of visitors. Multichannel engagement capabilities include SMS, email, and app push notifications.
Notify staff in real time of a visitor's presence through API triggers and WebEx Teams notifications to deliver a differentiated experience.
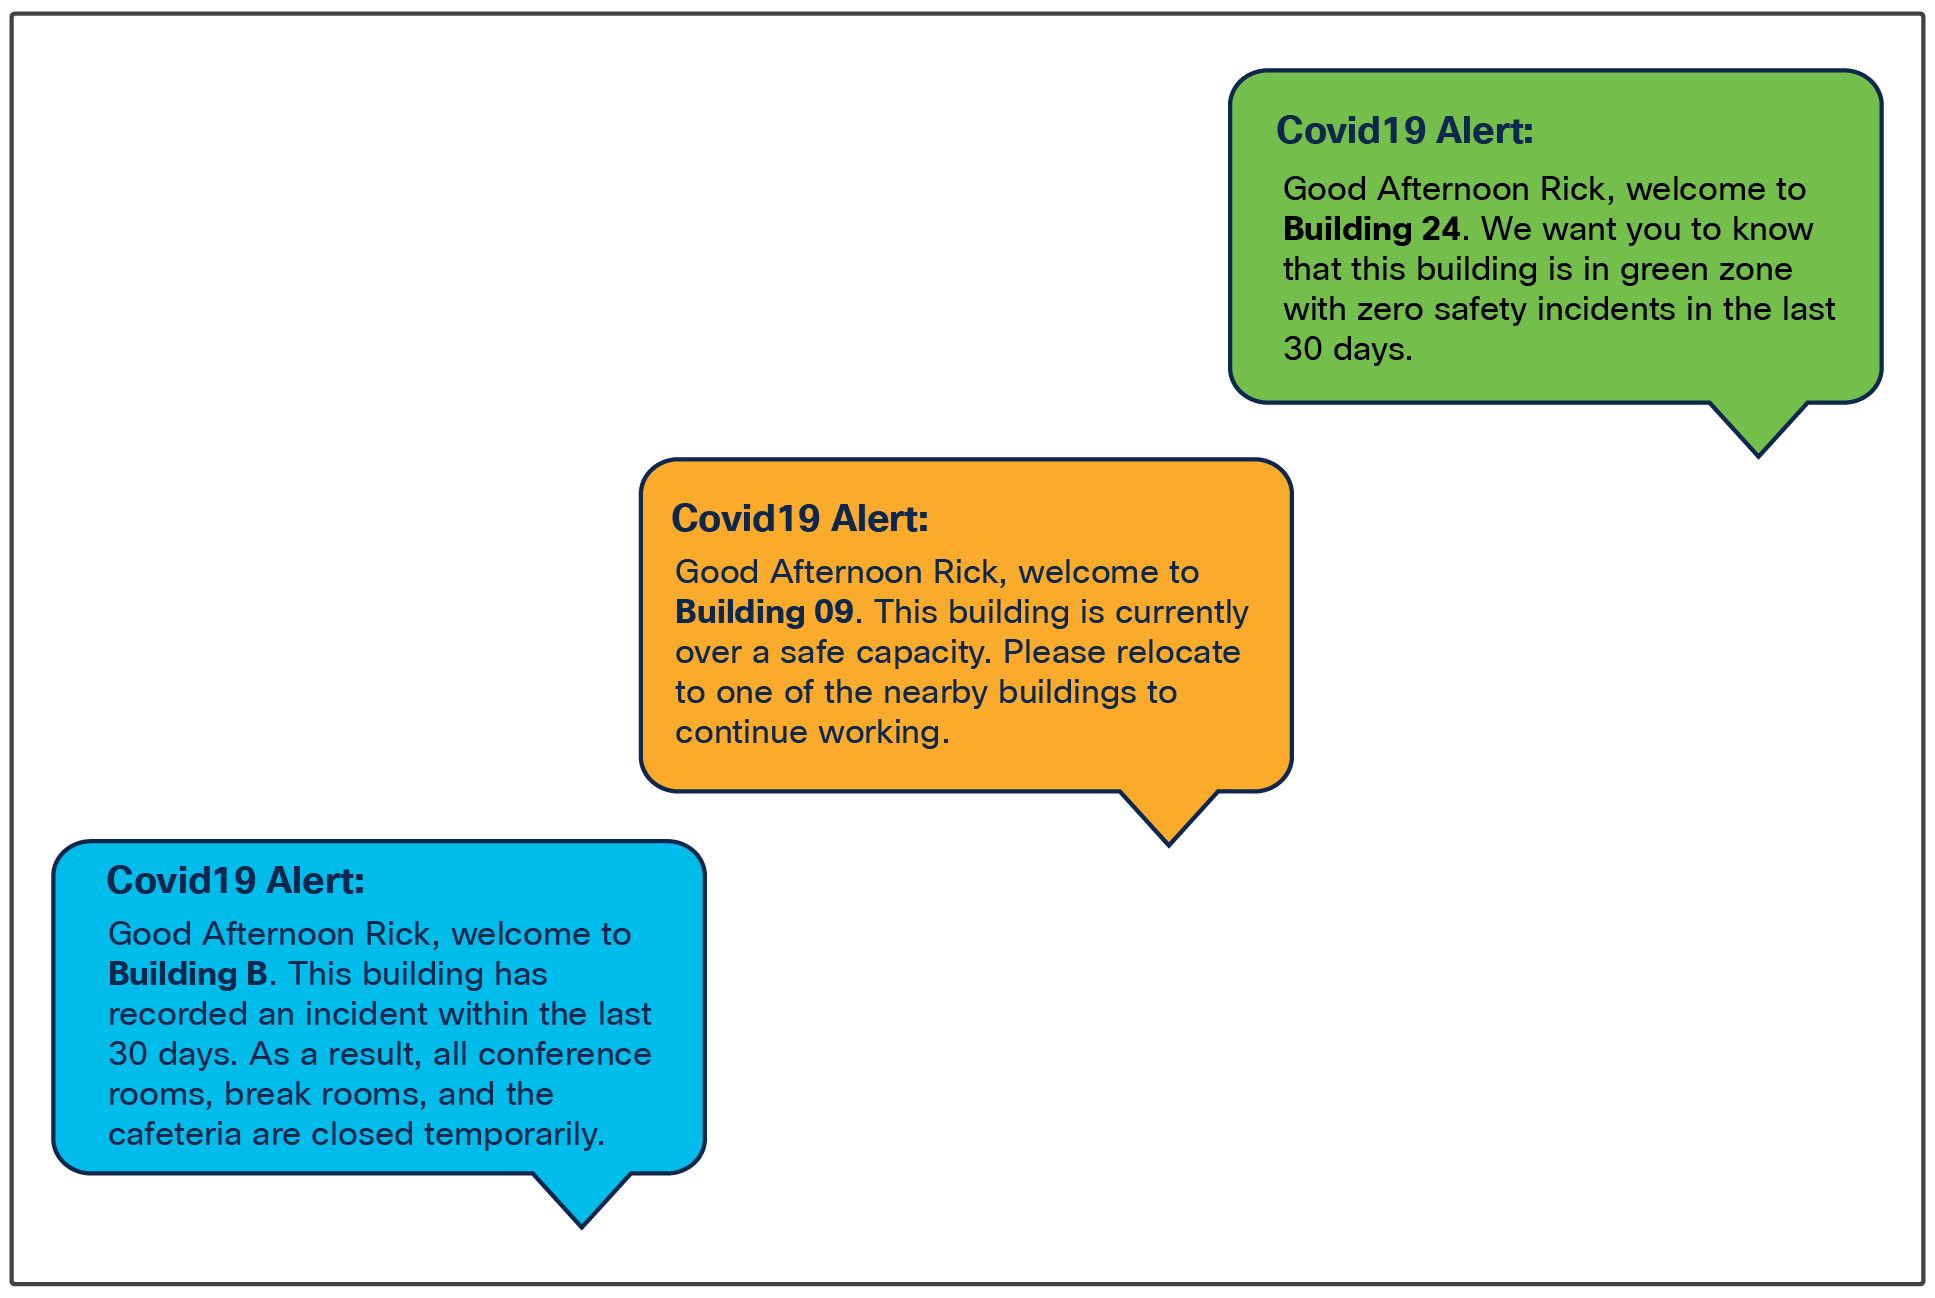
Notifications from the Engagements feature
Cisco Spaces SDK
The Cisco Spaces SDK (Software Development Kit) can help simplify the onboarding process drastically. With the Cisco Spaces SDK, app users can now connect quickly, securely and automatically to the Wi-Fi network, through the customer’s mobile app. It also opens up an at-location channel of communication, based on the user’s real-time location, besides providing location analytics.
Cisco Spaces Indoor IoT Services with Catalyst Wi-Fi 6 access points and 9000 switches helps you deliver IoT use cases rapidly, at scale, and at a significantly lower TCO. It is offered as a service and will allow you to manage the entire end-to-end process of ordering, onboarding, configuring, and managing multiple end devices. A unified support model offers end-to-end visibility, from the end device to the partner application.
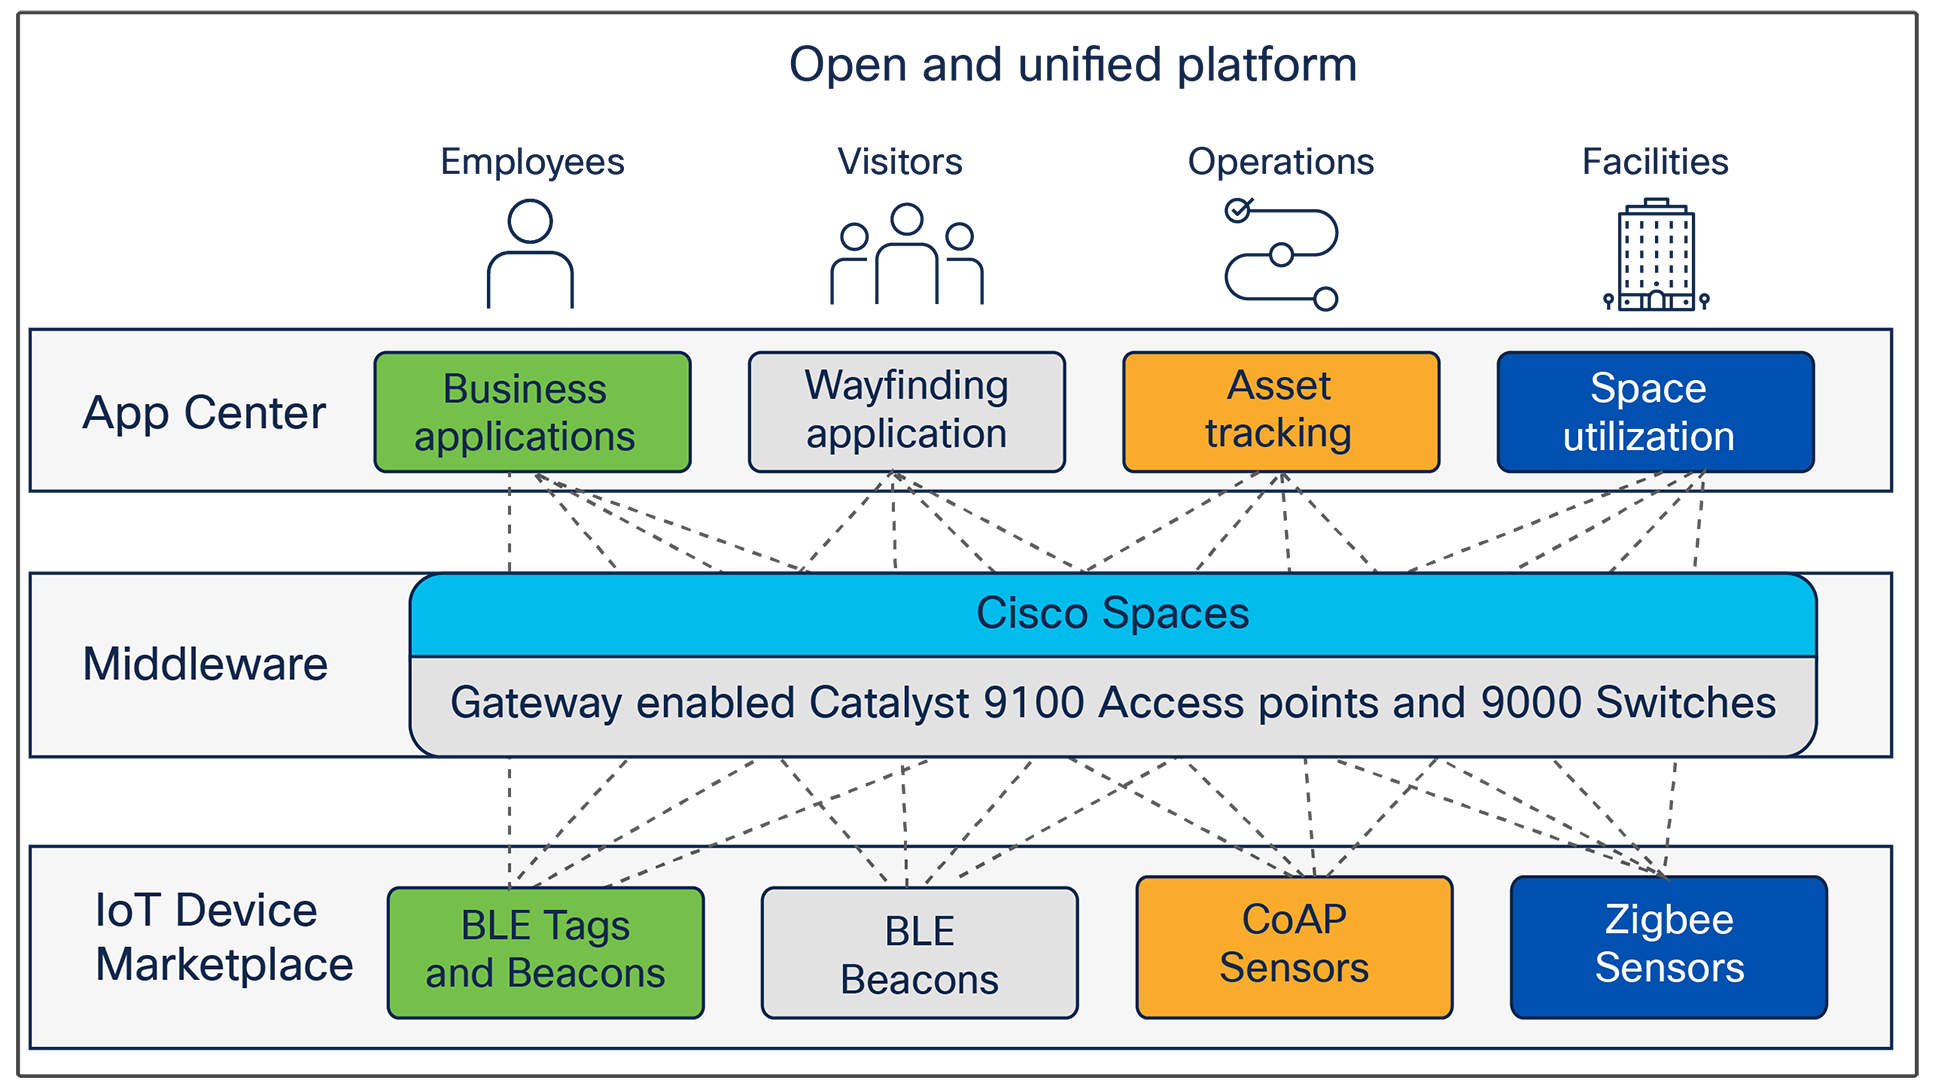
Cisco Spaces is an open and unified platform for enabling multiple devices and applications
(Zigbee sensors coming soon)
Dive outcomes at scale with the following benefits of Indoor IoT Services:
● Eliminate requirements for overlay networks or on-premises server
● Take full advantage of your gateway-enabled Wi-Fi 6 infrastructure
● Reduce TCO and manage a multivendor, multitechnology landscape with simplicity
● Scale out your IoT deployments quickly and efficiently
● Support multiple types of IoT technologies
● Access the IoT Device Marketplace, with a broad spectrum of validated end devices for industry use cases such as asset management, room finding, environmental monitoring, and more
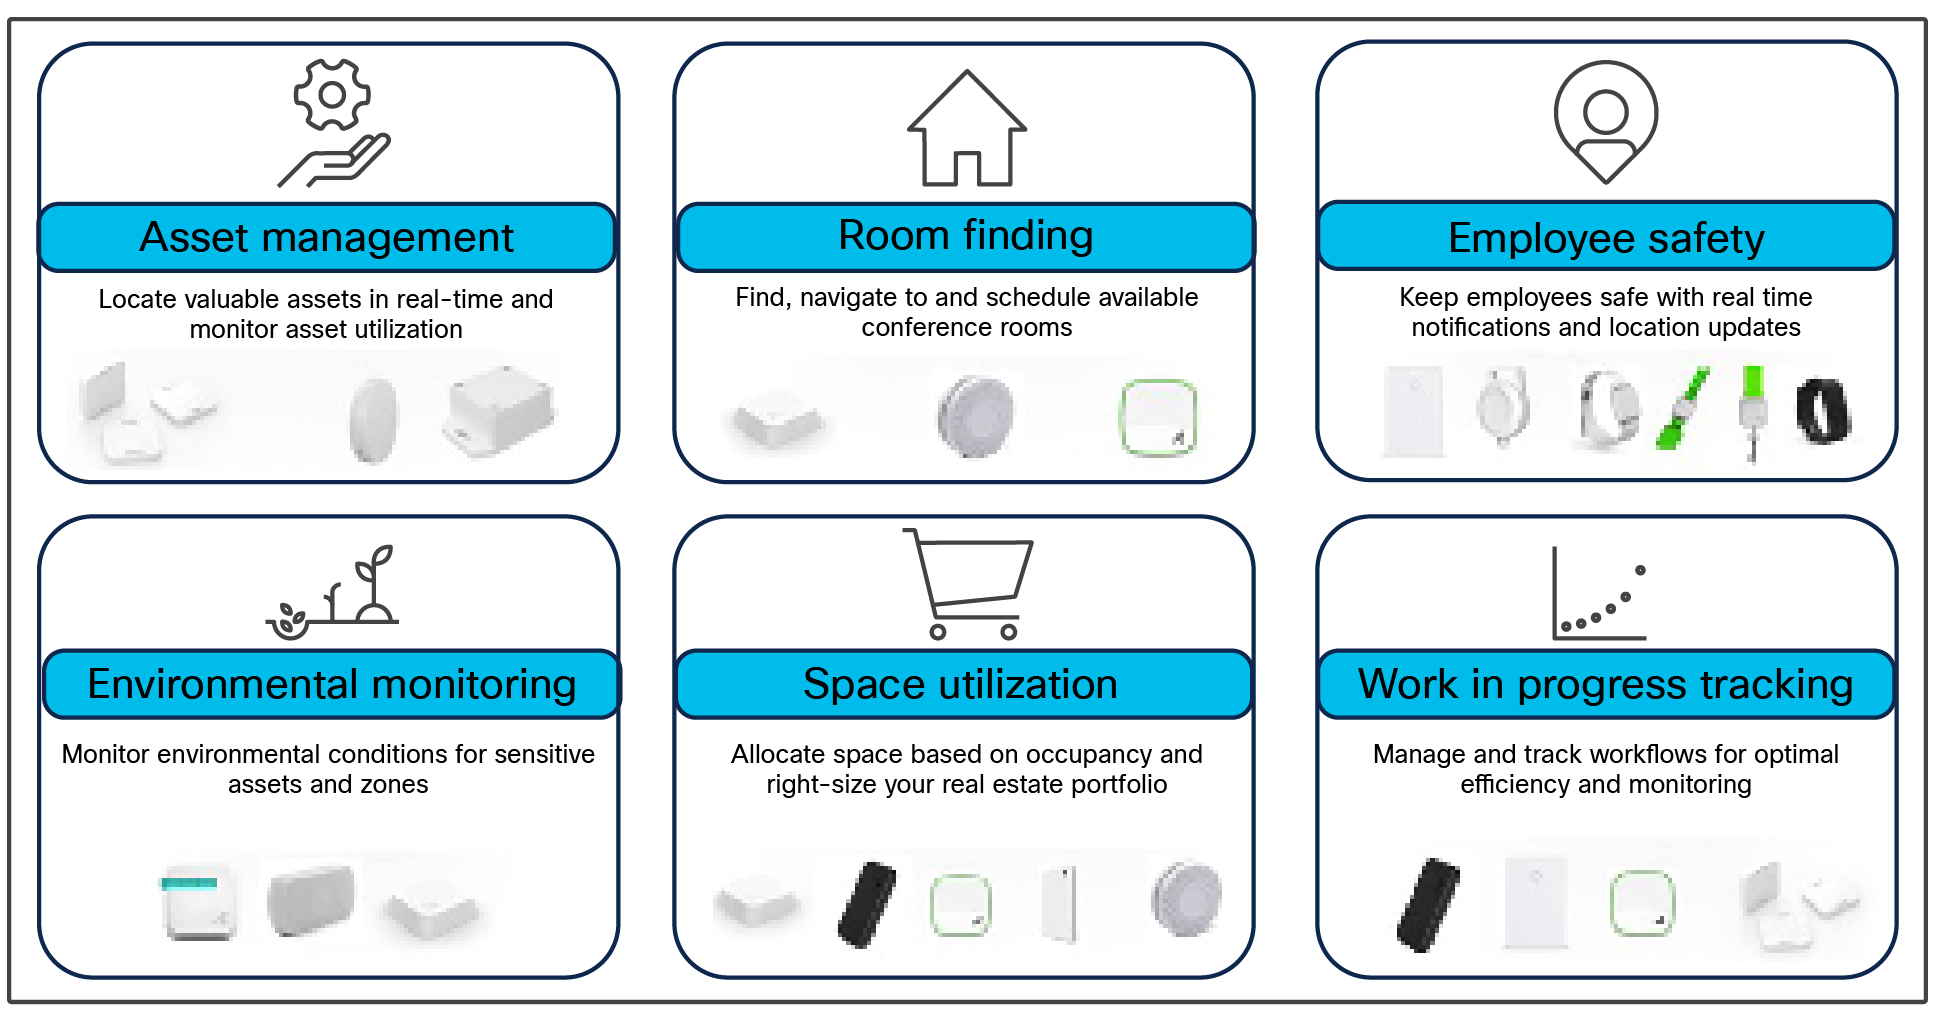
By leveraging a broader spectrum of end devices, you can advance these common use cases at scale
Access point gateways
Deploy cloud-managed Cisco Bluetooth Low Energy (BLE) gateways on your Cisco Catalyst 9100 Wi-Fi 6 access points. Using this new architecture, you can replace overlay networks and decouple the BLE end device from partner applications.
Wi-Fi 6 access point gateways enable BLE end devices such as BLE beacons and asset tags
Device inventory
Manage your device inventory and activate sensors, tags, and beacons through a centralized cloud dashboard. It supports access point beacons, third-party BLE devices, active RFID, Cisco Meraki video, and Cisco Webex®.
Device management
Configure, provision, and deploy your end devices. Manage AP beacons and third-party BLE beacons with native management and partner integrations. A workflow-based configuration tool automatically applies configurations to supported beacons based on user-defined criteria.
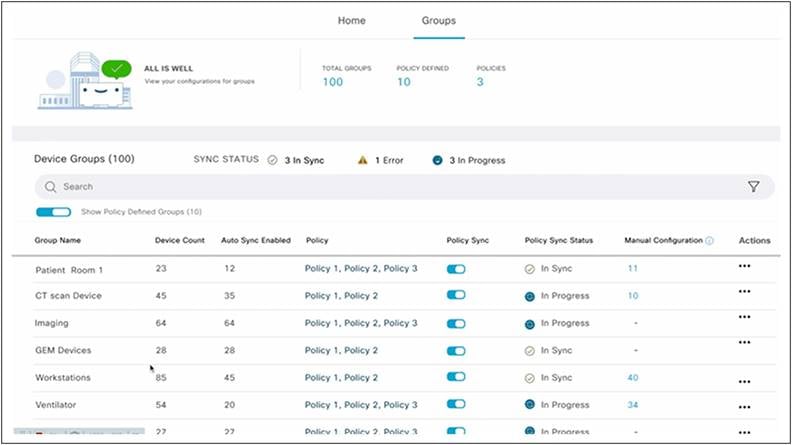
Group devices intuitively and apply configurations to these groups
Device monitoring and performance
Monitor the status of access point gateways and the overall health of your beacons through a cloud dashboard that provides device battery levels, last-heard timestamps, and firmware versions. Evaluate device performance to help ensure that devices act as expected.
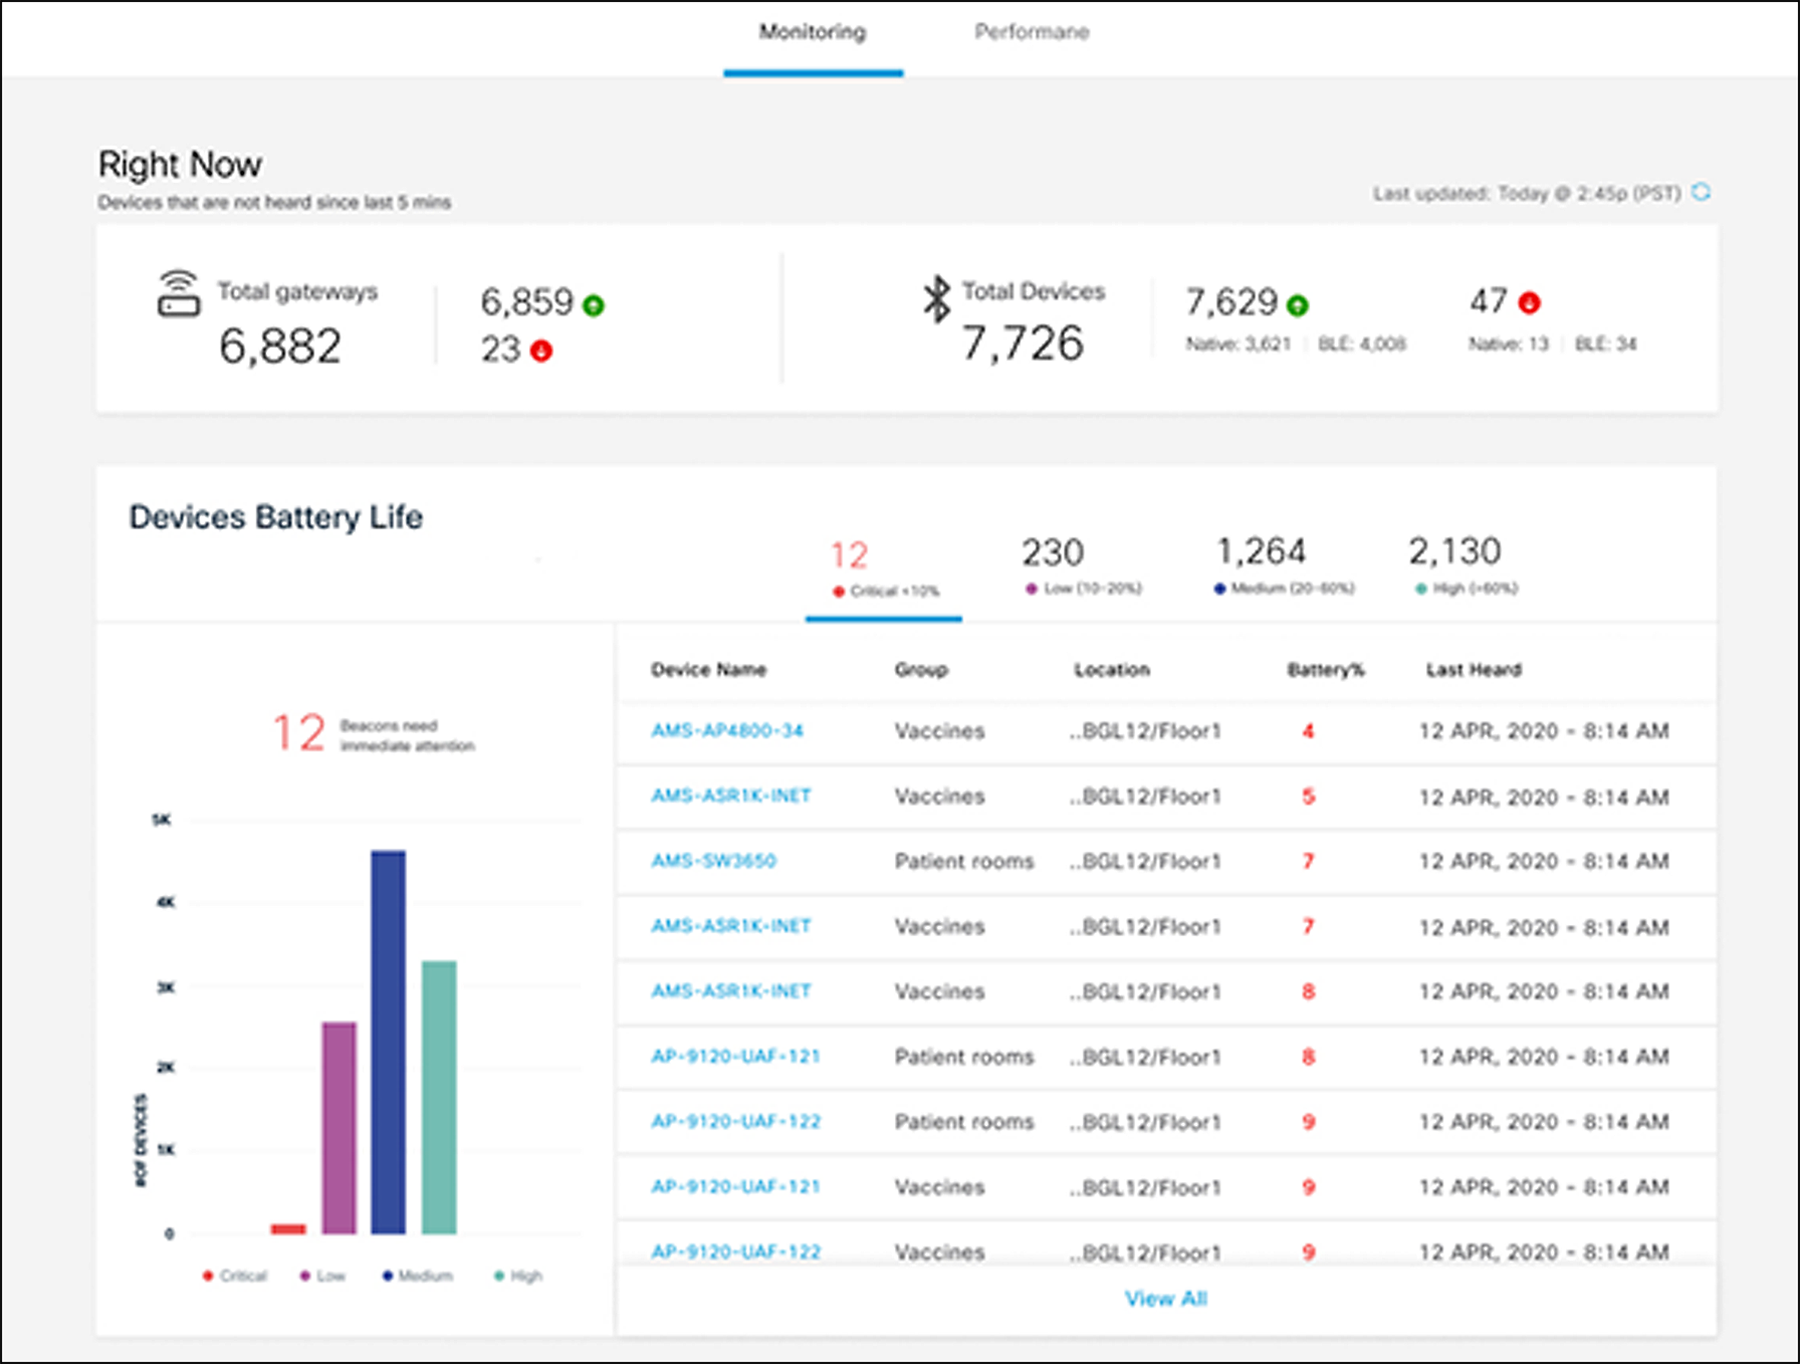
Monitoring and Performance dashboard for end devices and gateways
Industry outcomes with partners and integrations
Cisco Spaces has a wide variety of specialized applications, partners, and Independent Software Vendors (ISVs) available to drive industry-specific use cases. These solutions are validated and integrated with the end-to-end support model. Partners can take advantage of the ease of onboarding for new customers. Customers have full control over their data and privacy with these partner applications. In addition to the partner applications, the IoT Device Marketplace is a one-stop shop for discovering validated devices suitable for your specific use cases.
Partner App Center
Discover partner applications that can be quickly activated through the App Center. These applications can drive various industry-specific use cases, such as asset management or infant tracking in healthcare settings. The integration of these partner applications with Cisco Spaces enables faster time to deployment. You can connect your wireless and activate a partner application within minutes.
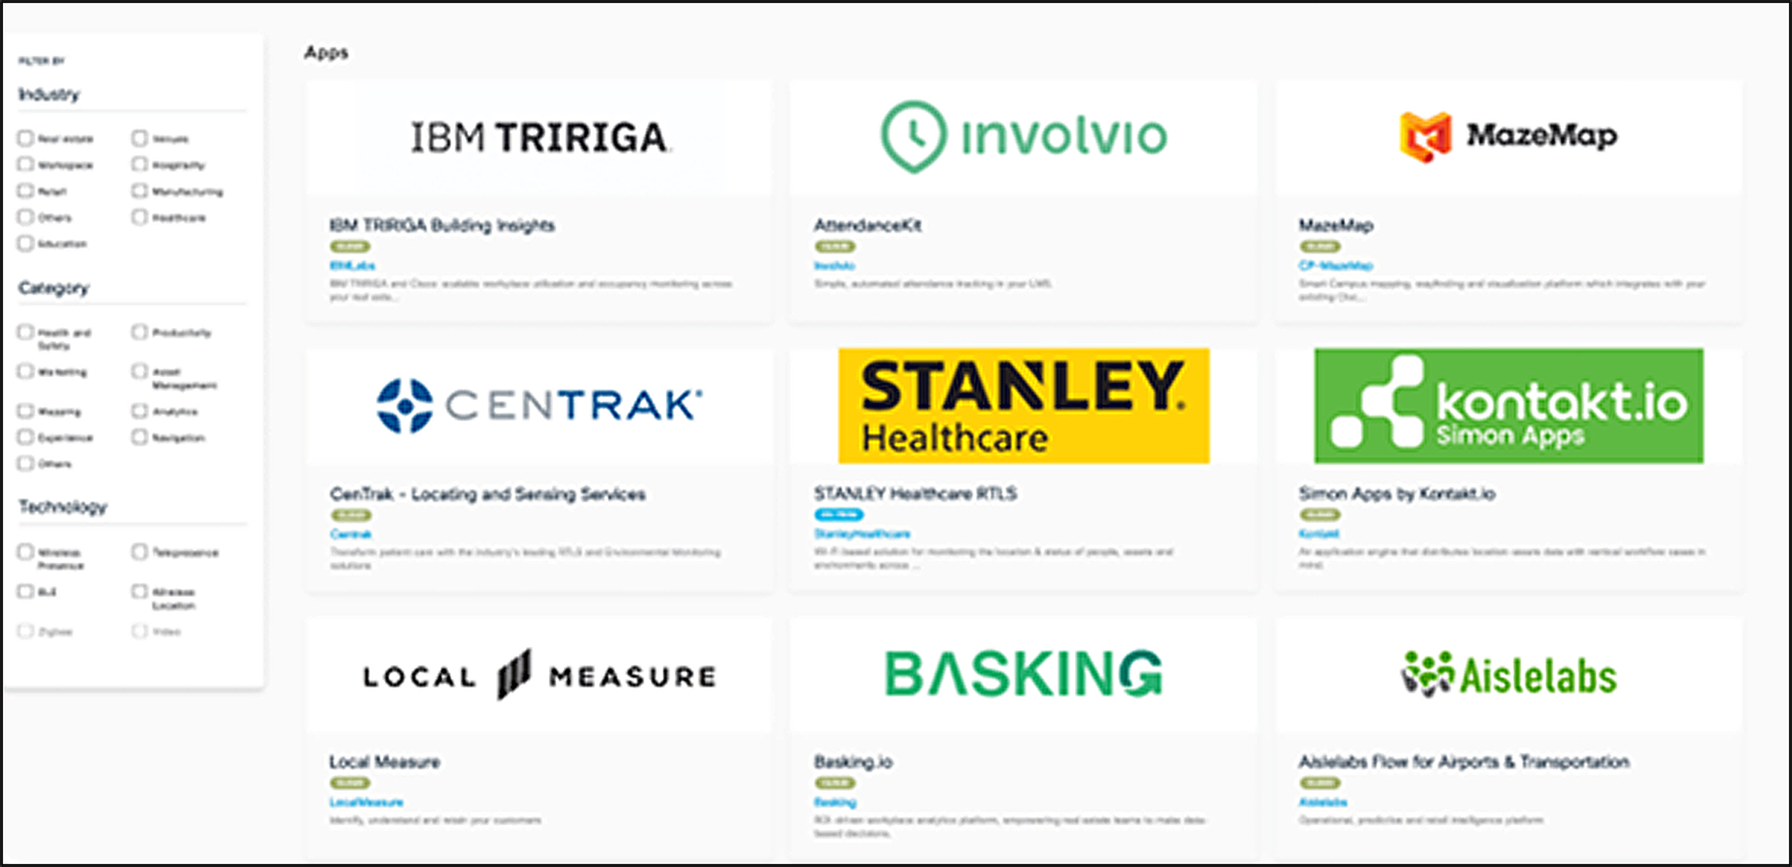
App Center with industry-specific partner applications
IoT Device Marketplace
The IoT Device Marketplace (IDM) features a large ecosystem of partner vendor devices and sensors. It provides flexibility in choosing your end devices based on the technology, form factor, price, and use case. You can view the details, use cases, and suitable partner apps for each end device, as well as request a quote. The device vendors are validated and are integrated with the Cisco Spaces end-to-end support framework. End devices ordered through the IoT Device Marketplace can be activated and managed through Cisco Spaces.
To learn more about the IDM, visit:
https://dnaspaces.io/devicemarketplace/home
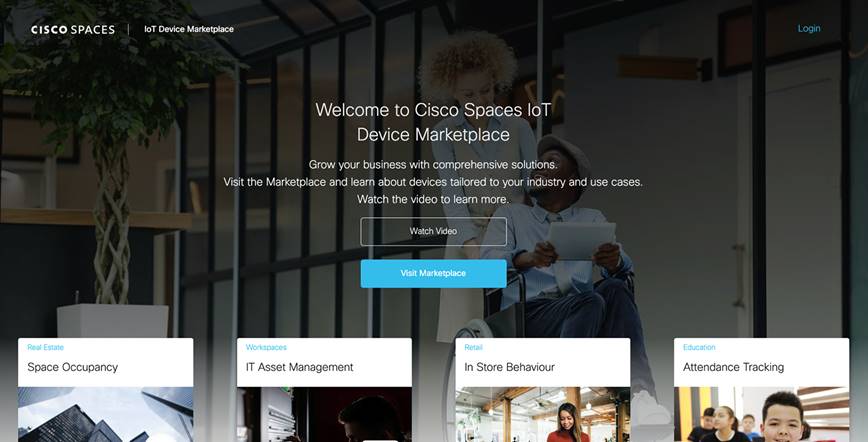
The IoT Device Marketplace features a variety of supported end devices that you can discover and order
Next-generation wireless onboarding
Many businesses must take their wireless beyond connectivity to digitize physical spaces and drive business outcomes. As businesses deploy these use cases, they encounter a multitude of wireless onboarding challenges, as described below.
Wireless onboarding challenges
● MAC randomization: MAC randomization is often implemented to preserve privacy for end users.
● Limited customer insights with low guest Wi-Fi attach rate: Guests face a multistep onboarding process and may lack confidence in the authenticity of the Wi-Fi network. This leads to lower Wi-Fi attach rate and limited data for analytics.
● Limited indoor carrier coverage: Businesses face limited indoor carrier coverage, which can lead to a negative customer experience.
● Monetization opportunities: Enterprises want to explore more avenues to monetize their Wi-Fi investment.
● Loyalty customer engagement: Enterprises face challenges in offering differentiated experiences for loyalty customers and customer acquisition.
● Onboarding management: Businesses need to effectively manage the onboarding experience across multiple locations.
MAC randomization impacts
MAC randomization involves generating a rotating MAC address to prevent user tracking through the MAC address. The devices can change and use different MAC addresses with each Wi-Fi network, which limits user tracking and supports privacy requirements. MAC randomization has been implemented as part of the latest software releases, which many consumers are expected to adopt.
MAC randomization impacts networks in several ways:
● Onboarding: MAC-based onboarding will require reauthentication; otherwise, returning visitors will be categorized as new users.
● Analytics: Analytics are rendered unreliable in counting repeat visits and visitors, and past data may not properly indicate frequency and visits.
● Troubleshooting: Teams will be unable to use the previous MAC address for troubleshooting.
● MAC-based apps: All MAC-based apps, such as Proximity Reporting, will be impacted.
How Cisco Spaces addresses MAC randomization
Cisco believes that privacy is a fundamental human right, and Cisco embraces MAC randomization as the right practice for protecting user privacy. OpenRoaming helps solve many of the problems associated with using a MAC address. OpenRoaming, launched by Cisco and now part of the Wireless Broadband Alliance (WBA) standard, authenticates users by using a private, unique identifier that protects the user’s identity. It does this by leveraging a federation of identity providers (device manufacturers, carriers, loyalty programs, cloud ID, etc.) to provide a unique identity that can be used to drive user policy. This is done in a more private and secure way than with MAC addresses. Going forward, Cisco Spaces will deliver solutions that use other privacy-friendly parameters instead of the MAC address, through the alternative onboarding solutions highlighted below.
OpenRoaming is part of the WBA standard, expanding and unifying the ecosystem with one federation
Cisco Spaces delivers next-generation onboarding through the following key value drivers:
● Seamless and secure Wi-Fi onboarding experience
● Customer acquisition and customer loyalty experience
● Enhanced carrier indoor coverage
● Use of Wi-Fi for monetization with higher Wi-Fi attach rate
Seamless and secure Wi-Fi onboarding experience
Seamlessly and securely onboard visitors with OpenRoaming and increase Wi-Fi attach rates to generate more powerful location insights.
How it works:
1. The property IT manager enables OpenRoaming for the wireless network through Cisco Spaces.
2. A customer installs the OpenRoaming mobile app and signs in with a Google or Apple ID. If the customer doesn’t already have the mobile app, the property can send a QR code or web link to download the app.
3. The customer walks into any of the locations and is seamlessly and securely connected to the OpenRoaming SSID.
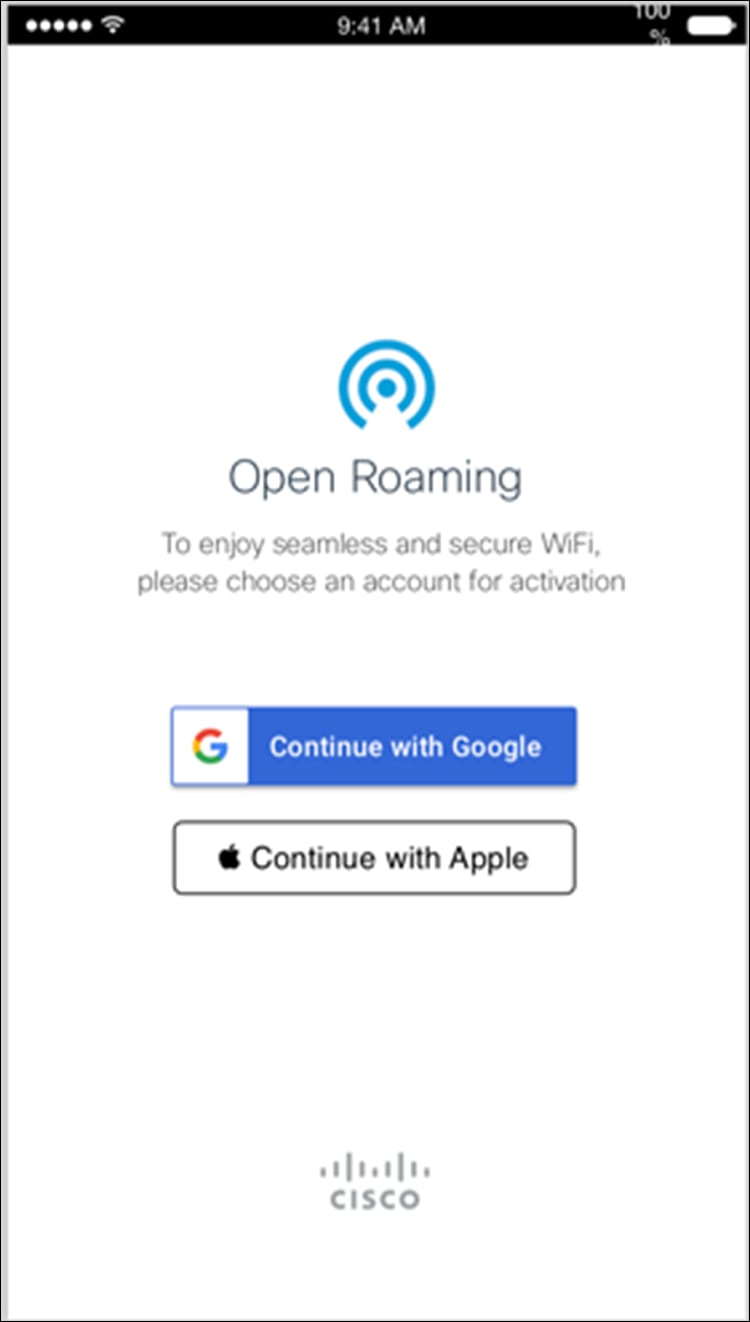
OpenRoaming mobile app
Customer acquisition and customer loyalty experience
Leverage OpenRoaming and the Cisco Spaces Software Development Kit (SDK) to acquire new customers to loyalty programs and provide differentiated, contextual, and location-based experiences.
How it works:
1. A customer enters the location and gets a notification through the loyalty app about seamless onboarding with OpenRoaming. The customer accepts the offer to be connected to the OpenRoaming SSID.
2. The customer connects to the OpenRoaming SSID seamlessly and receives relevant and contextual engagements during future visits.
Enhanced carrier indoor coverage
Provide reliable indoor coverage via automatic handoff between cellular and Wi-Fi while realizing cost savings.
How it works:
1. A customer (service provider user, for example, an ATT or T-Mobile user) walks into a location and is seamlessly connected to the OpenRoaming SSID, instead of staying on carrier LTE.
2. The location gets better indoor coverage with huge cost savings comparing to Distributed Antenna System (DAS) deployment, and also gains insights into customer behavior.
Wi-Fi monetization
Turn Wi-Fi investments into a revenue source via service provider offload, and monetize captive portals through sponsors, events, and other tenants.
How it works:
1. A customer enters a location and is seamlessly connected to the OpenRoaming SSID, instead of staying on carrier LTE.
2. The property IT manager now receives revenue from service providers though Cisco Spaces partners (Boingo, Google Orion, etc.).
Table 1. Key Cisco Spaces industry-specific use cases
| Industry |
Use case |
| Retail |
● Onboard and acquire customers and loyalty program members, expand customer base.
● Offer a differentiated experience based on location and persona.
● Understand in-store shopper behavior.
● Understand peak times, benchmark performance, and measure the impact of events.
● Integrate with enterprise systems and unlock data to drive outcomes from external systems.
|
| Hospitality |
● Understand on-property guest and visitor behavior.
● Enable loyalty sign-ups; co-branded marketing engagements, such as credit-card sign-ups; and elite-member differentiation.
● Differentiate the guest experience based on brand and guest behavior types.
● Explore new monetization avenues from food and beverage (F and B), convention centers, and others.
● Integrate with enterprise systems, and unlock data to drive outcomes from external systems.
|
| Workspaces |
● Visualize meeting room availability and utilization, temporarily hold rooms.
● Understand Real-time Occupancy & Air Quality at buildings, floors and meeting rooms.
● Deliver contextual notifications to employees based on location and behavior.
● Optimize space utilization and occupancy with actionable insights. Correlate with energy, F and B, and others.
● Onboard workspace visitors and guests to Wi-Fi.
● Integrate with enterprise systems (such as Building Management Systems [BMS], Human Resources Management Systems [HRMS], and HVAC), and unlock data to drive outcomes from external systems.
|
| Healthcare |
● Track and manage assets: Locate key assets to help reduce costs and save time.
◦ Monitor environmental conditions of refrigerators, freezers, and facility spaces to prevent spoilage of pharmaceuticals.
● Provide a panic button for staff safety and infant and patient protection.
● Improve patient throughput.
● Automate monitoring and reporting of hand hygiene compliance.
● Integrate with enterprise systems, and unlock data to drive outcomes from external systems.
|
| Manufacturing |
● Understand employee behavior that affects performance and satisfaction.
● Optimize space utilization with actionable insights.
● Perform asset tracking and management.
● Provide a panic button for staff safety.
● Onboard visitors to Wi-Fi.
● Deliver contextual notifications to employees based on location and behavior.
|
| Education |
● Build smart captive portals for students, guests, and faculty.
● Automate participation grading based on attendance tracking.
◦ Gain insights into student behavior and time spent on campus.
● Analyze attendance trends and identify areas for improving campus engagement.
◦ Trigger contextual engagements at on-campus venues, based on location and behavior.
● Automate attendance tracking.
|
“The two core principles Intu Properties has are they want to make people dwell for longer and come back more often. If we can use Cisco Spaces to do that, then it means that they’re starting to see more revenue because retailers see higher football and people are hanging around for longer and spending more money….As we move more into data and software and start to embrace Cisco Spaces and other product sets, that’s how we’re going to stay alive and relevant.”
Martin Young
Head of Commercial and Enterprise Business, Block Solutions
“Before we deployed the Cisco solution, it was up to each club to set up its own wireless access and portal. Now it is easy to set up different events for different types of venues. In addition to football, we can and have established portals for hockey matches in the National Arena, motorcycle races, and other attractions. It gives our venues much more value because the experience can be customized to the specific event.”
Thomas Torjusen
Head of Media and Chief Digital Officer, Norwegian Professional Football League
“Cisco Spaces has become very handy at our football stadium, where we have a lot of visitors to the game, and we can know more about who’s visiting, how frequent they’re visiting, how much they’re using the network and know who they are so we can engage them about other sporting events.”
Shai Silberman
Director of Network Services, San Jose State University
Flexible payment solutions to help you achieve your objectives
Cisco Capital® makes it easier to get the right technology to achieve your objectives, enable business transformation, and stay competitive. We can help you reduce the total cost of ownership, conserve capital, and accelerate growth. In more than 100 countries, our flexible payment solutions can help you acquire hardware, software, services, and complementary third-party equipment in easy, predictable payments. Get more details.
For a more detailed overview on Cisco Licensing, go to cisco.com/go/licensingguide.
If you're ready to get more from your Wi-Fi, contact dnaspaces-sales@cisco.com.
Visit cisco.com/go/spaces for more information.